
“Observe the endless frontier of technology; gain insights into the future and lead a new era of investment research.”
This report is provided by the “WTR” Research Institute:
Member Twitter ID:
Golden Egg Diary @jindanriji; Elk won't get lost @crypto_elk_; Forex Brother; Xibei @Asterismone;
The first round of WTR on-chain data subscription (OG) is officially open!
Data provided: WTR’s self-developed market short-term, medium-term, and long-term on-chain data, as well as data on some small cryptocurrencies.
First round pricing: 399U/year. Payment supports on-chain and off-chain transfers.
Other instructions: We have prepared a strategy package for OG users, with limited slots available. The current strategy package is only open to first round OG users. Subscriptions can directly add to the OG user group; please refer to X or WeChat public account for details.

Weekly review
From November 17 to November 24, Ice Sugar Orange reached a high near $96,043 and a low close to $80,600, with a fluctuation range of around 14%.
Observing the chip distribution chart, there are a large number of chips traded around 90,000, which will provide certain support or pressure.
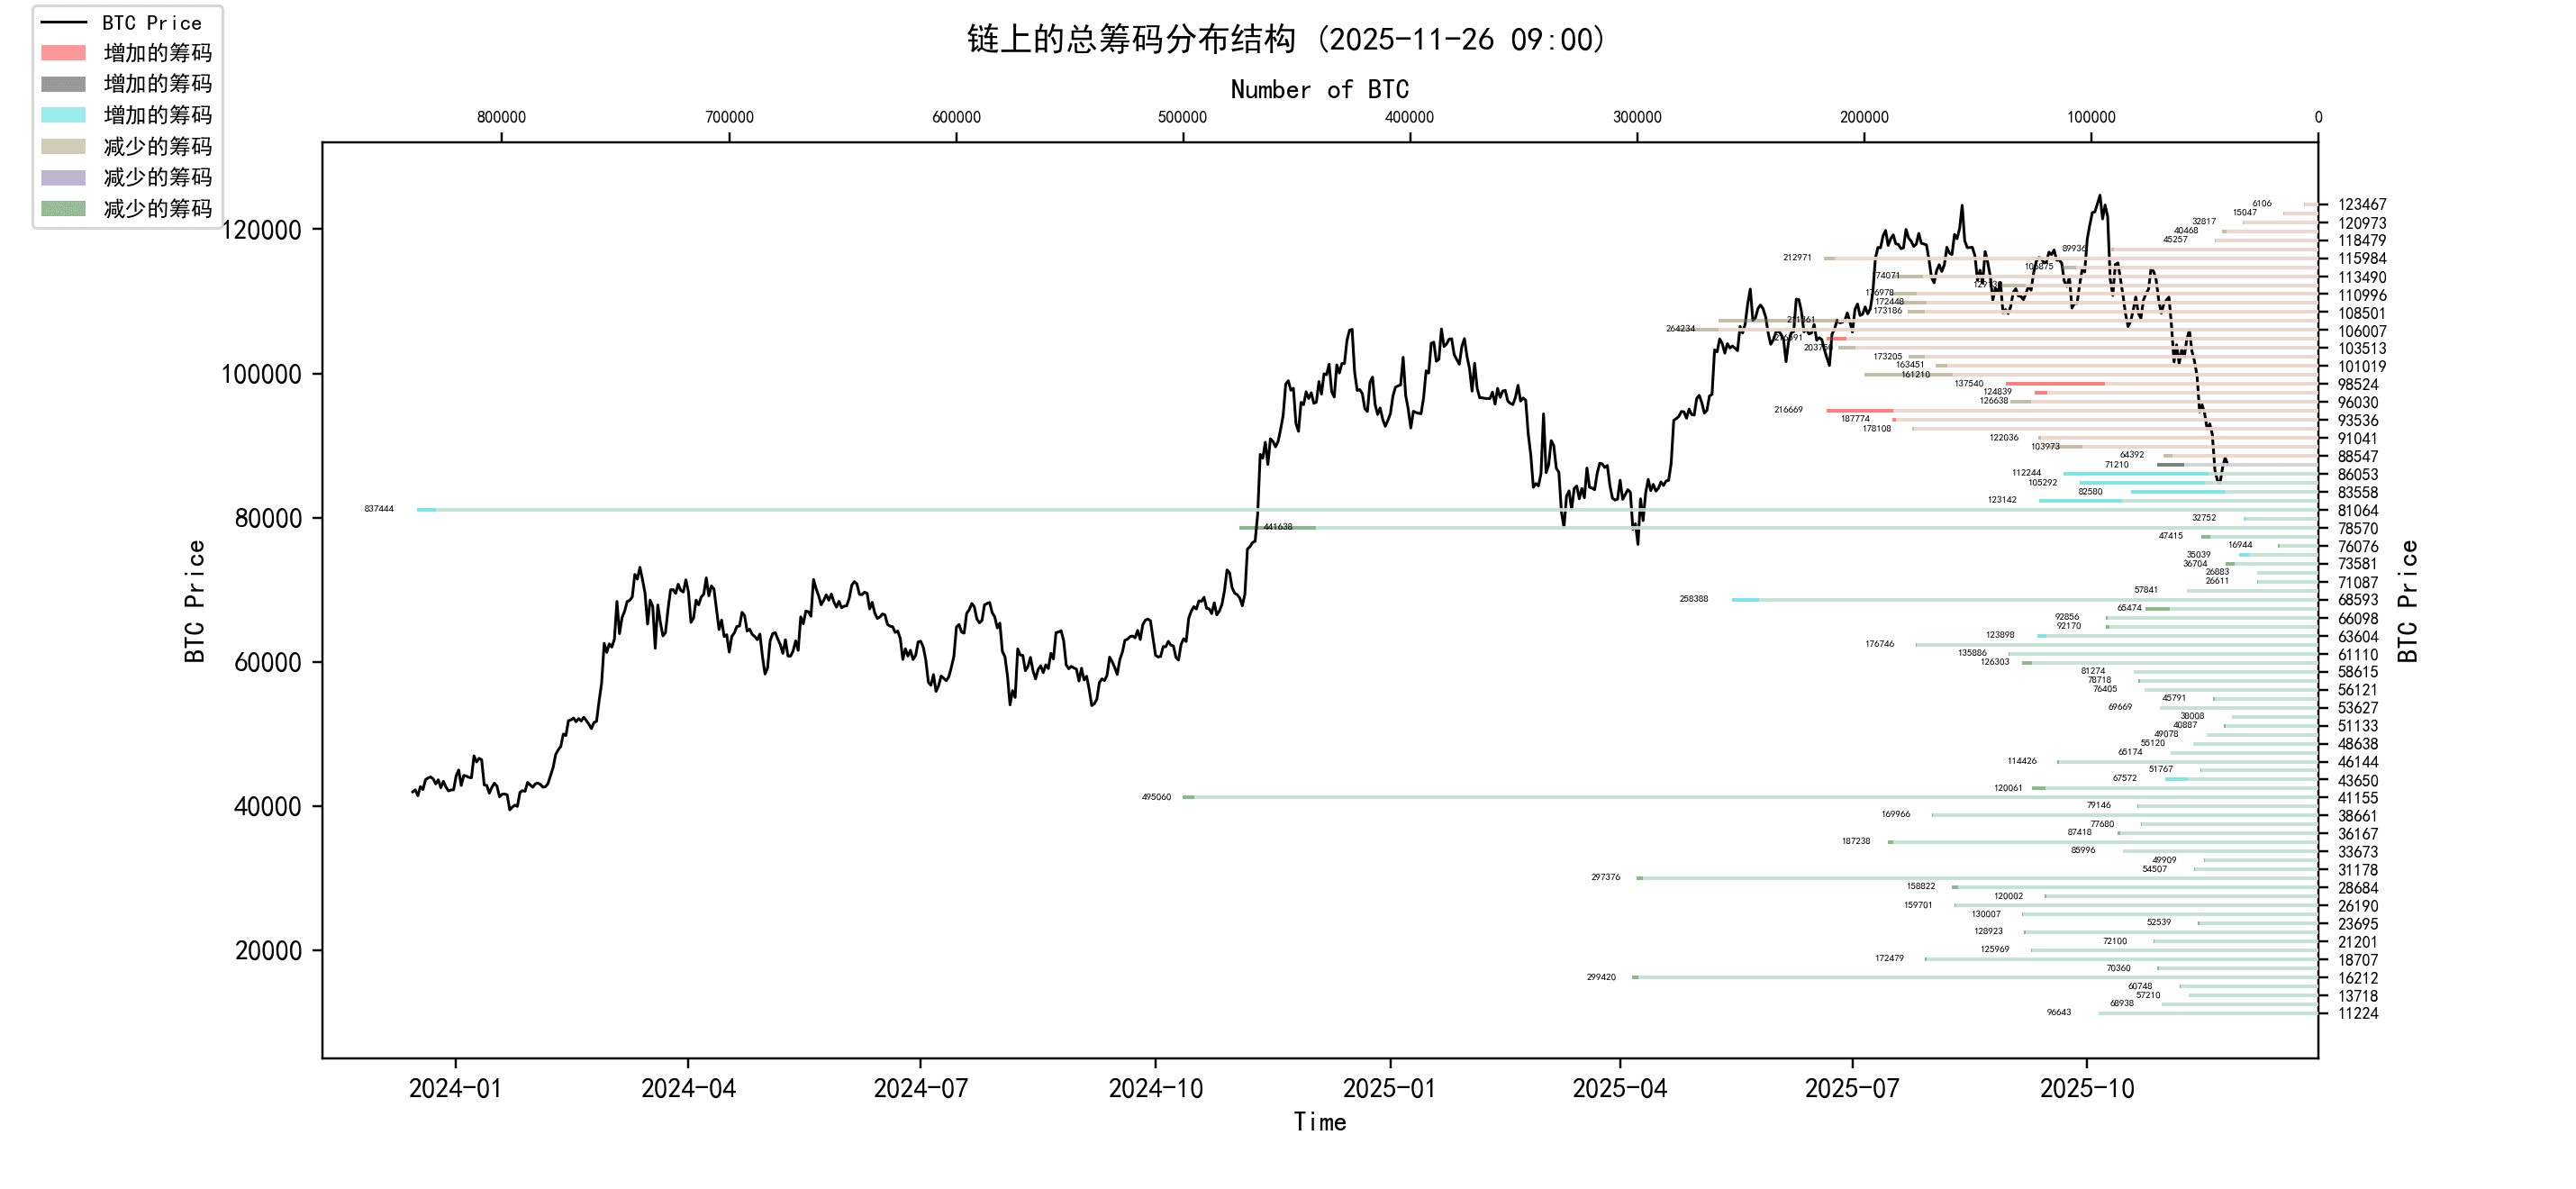
Analysis:
60000-68000 approximately 937,000;
76000-89000 approximately 1.91 million;
90000-100000 approximately 1.35 million;
Above 100000 approximately 2.56 million;
Important news aspect
In terms of economic news
Federal Reserve monetary policy and interest rate cut expectations:
Core figures' statements: Many members of the Federal Reserve 'collectively dove'.
Williams (an ally of Powell): His remarks were interpreted by the market as a consensus signal among the Federal Reserve's top leaders, and even the three most influential members (Powell, Williams, Waller) support a new round of easing actions. He stated that although the inflation process is stalled, it is expected to reach the 2% target by 2027.
Other members: Director Milan said that insufficient data does not mean there are no predictions; Jefferson believes that the rise in AI stocks is due to actual earnings, different from the internet bubble; Logan expects the Federal Reserve's balance sheet to soon resume growth.
Market reaction: As a result, the market has significantly corrected expectations, with the probability of a 25 basis point rate cut in December quickly rising to nearly 70% (above 70%). The Nasdaq index rose 2.6% during the day, the S&P 500 rose 1.6%, and gold rose to $4,120 per ounce.
Analysis of the economy and job market:
Goldman Sachs view: The Federal Reserve is expected to cut rates in December. Increasing layoffs indicate that the labor market's weakness may be solidifying, thus limiting the impact of mild economic growth.
Jefferies Group view: The relaxation of regulations by US banks is expected to release about $2.6 trillion in lending capacity for large financial institutions, mentioning that Trump is planning to soften the banking capital measures established after the 2008 financial crisis.
European Central Bank dynamics:
Lagarde (President of the European Central Bank): If the AI wave in Europe is similar to the spread of electricity in the 1920s, annual productivity growth may increase by about 1.3 percentage points; if it follows the path of the US digital prosperity in the late 1990s, the increase will be close to 0.8 percentage points. Embracing AI intelligence can still allow Europe to maintain its advantage.
In terms of cryptocurrency ecosystem news
Dynamics of ETFs and institutions:
New ETF approvals:
The New York Stock Exchange (NYSE Arca) has approved the listing of Franklin Templeton's XRP spot ETF.
Approval of Grayscale's DOGE and XRP spot ETFs, which officially began trading this Monday.
Background: Against the backdrop of the end of the US government shutdown and the SEC's noticeable easing of scrutiny on crypto ETFs, ETF products have surged.
ETF fund flows (last week's data):
BTC spot ETF: Outflows of $1.216 billion (BlackRock's IBIT net outflow of $1.0857 billion, Fidelity's FBTC outflow of $115.8 million, Grayscale's BTC inflow of $274.1 million).
ETH spot ETF: Cumulative outflow of $500.2 million.
SOL spot ETF: Since its listing on October 28, it has recorded net inflows for 19 consecutive trading days, with a total inflow of $510 million.
Institutional holdings: Bitmine increased its holdings by 63,123 ETH (valued at $174 million) last week, bringing its total holdings to 3.623 million ETH (valued at $9.96 billion), surpassing BlackRock to become the largest holder of ETH.
Policies and regulations:
Hong Kong: Financial Secretary Paul Chan stated that they are jointly promoting research on the applicability of existing laws to tokenized bonds, with details to be announced in the first half of next year, promoting the adoption of tokenized technology in Hong Kong's bond market.
New Zealand: Minister of Education Erica Stanford stated that starting in 2026, modern financial literacy courses covering digital assets and blockchain technology will be incorporated into the national curriculum.
Market data and on-chain analysis:
Price performance: BTC increased by 1.5% on Monday's opening, and ETH increased by 5.3%.
Whale dynamics:
Analyst Murphy pointed out that super whales holding 10,000 to 100,000 BTC increased their holdings by 68,030 BTC from November 4 to 20. This group reduced their positions after peaking in July last year, until BTC fell below $106,000 this October and began to increase their holdings again.
Vida, founder of Equation News, stated that they are gradually increasing their holdings in projects with particularly small market caps and liquidity value, while also increasing BTC (if it crashes to $77,000 within the week, they will allocate 5% of their worth to BTC).
Exchange flow: Coinglass data shows a net outflow of 29,194.49 BTC and an outflow of 210,000 ETH from centralized platforms in the past 7 days.
Sentiment index: On November 24, the cryptocurrency fear and greed index rose to 19 (indicating extreme fear), with a weekly average of 14.
Views and strategies:
Bitwise's view: Chief Investment Officer Matt Hougan stated that the market will soon start to reprice around the positive impact of the ETH Fusaka upgrade on December 3, which is an undervalued catalyst.
Correlation analysis: Strategist Peter Tchir believes that cryptocurrency, AI, and passive investment funds in US stocks have formed a high correlation, deeply binding through ETF tools like QQQ with cryptocurrency vault (DAT) companies and AI giants' capital expenditure.
Risk barometer: Goldman Sachs trader Brian Garrett pointed out that many clients view BTC performance as a barometer for future risk appetite; if BTC improves, an end-of-year rally may recur.
Market judgment: After a deep adjustment, the market is in recovery, and analysts believe there is good value currently, with short-term support from Federal Reserve easing.
Long-term insights: Used to observe our long-term situation; bull market/bear market/structural changes/neutral state
Mid-term exploration: Used to analyze what stage we are currently in, how long this stage will last, and what situations we will face.
Short-term observation: Used to analyze short-term market conditions; as well as the occurrence of certain events under certain premises.
Long-term insights
Non-liquid long-term whales
Total selling pressure on-chain
BTC ETF net positions
Long-term holder term structure over six months
Large net transfers from exchange whales
Cost line of short-term speculators
Non-liquid long-term whales
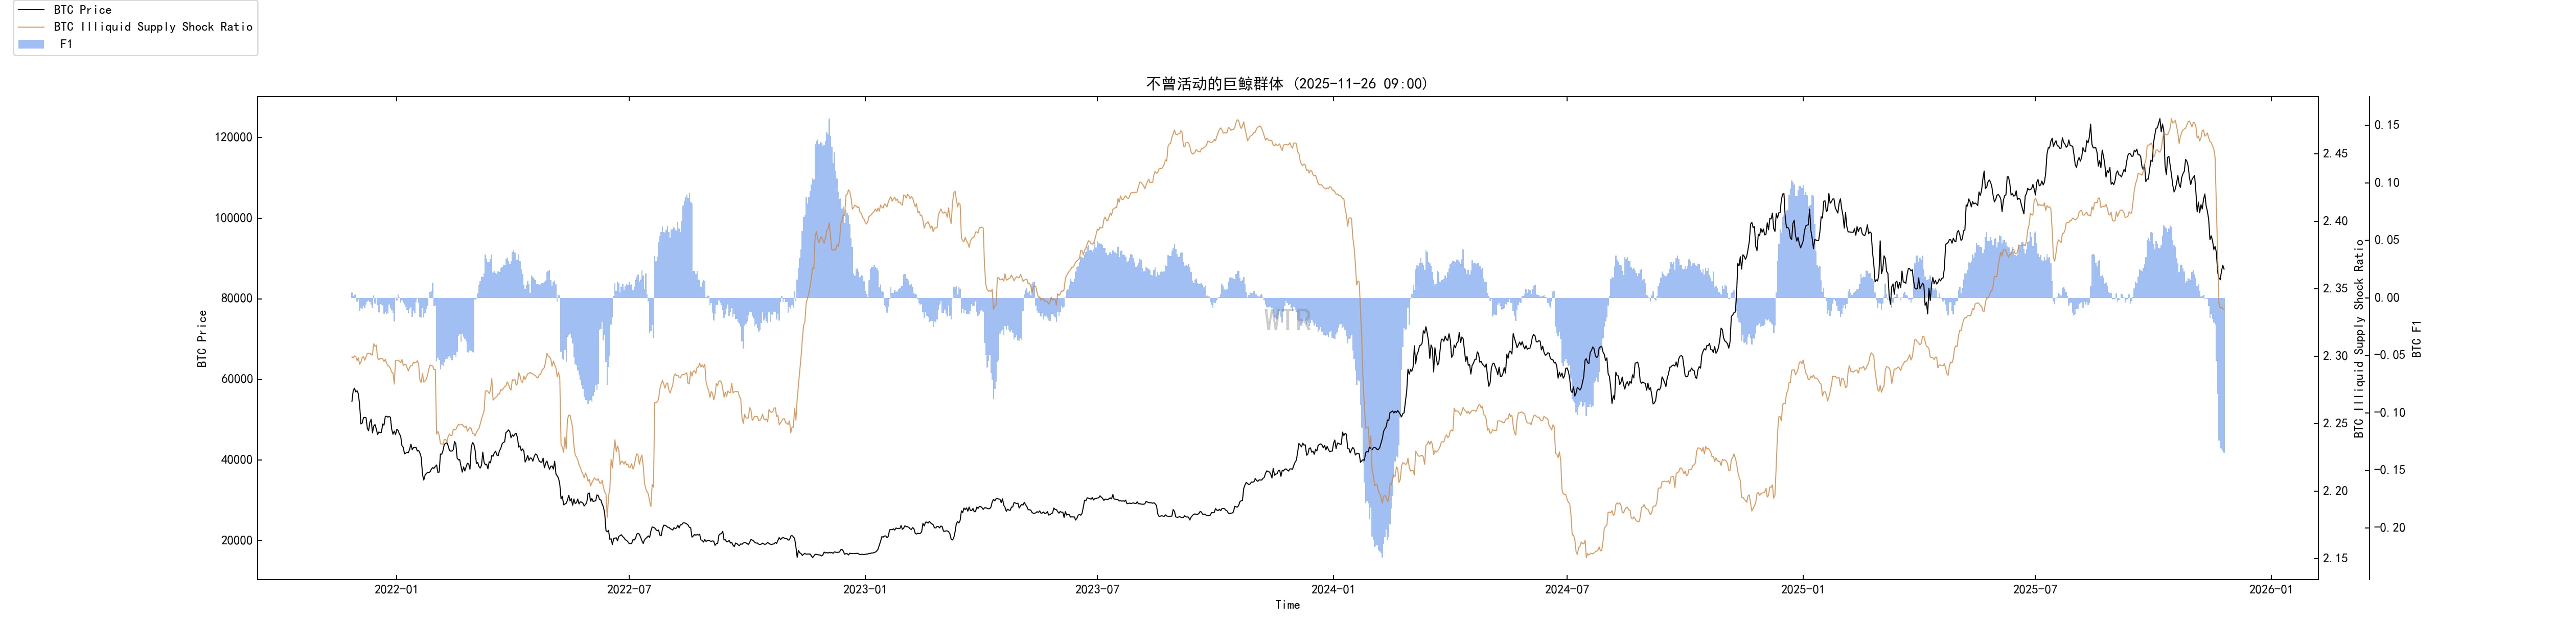
The behavioral path is very clear:
Prices have been continuously suppressed from around $116k to the $108.5k range, while non-liquid long-term whales rapidly increased their holdings, which is a typical high-position pullback buying action.
Then the price rose to around $125k, and the increase in this group's holdings has noticeably slowed or even stagnated, indicating that within this range, there is no longer a unified consensus on adding positions.
During the Friday crash three weeks ago (about 15%), non-liquid long-term whales showed almost no reaction, neither panicking to cut losses nor aggressively bottom fishing, just watching retail and ETFs fight.
Real selling occurs afterwards: after macro liquidity turns worse, and after large outflows from ETFs, this batch of long-term whales starts to reduce their positions in an organized manner, still in a stage of selling and observing.
Explanation:
This is not the kind of rough distribution that opens up on the same day at the peak, but rather first accumulated short-term chips during high position pullbacks and then slowly offloaded after the macro turned bad.
In other words, old money has not perfectly escaped the peak;
Rather, they acted as a buyer for a while and then used subsequent rebounds and liquidity windows to offload excess chips.
The latest data is disturbed by Coinbase address consolidation; the extremes should not be taken seriously, but in the big direction, long-term non-liquid whales have indeed shifted from net buying to net selling.
Total on-chain selling pressure
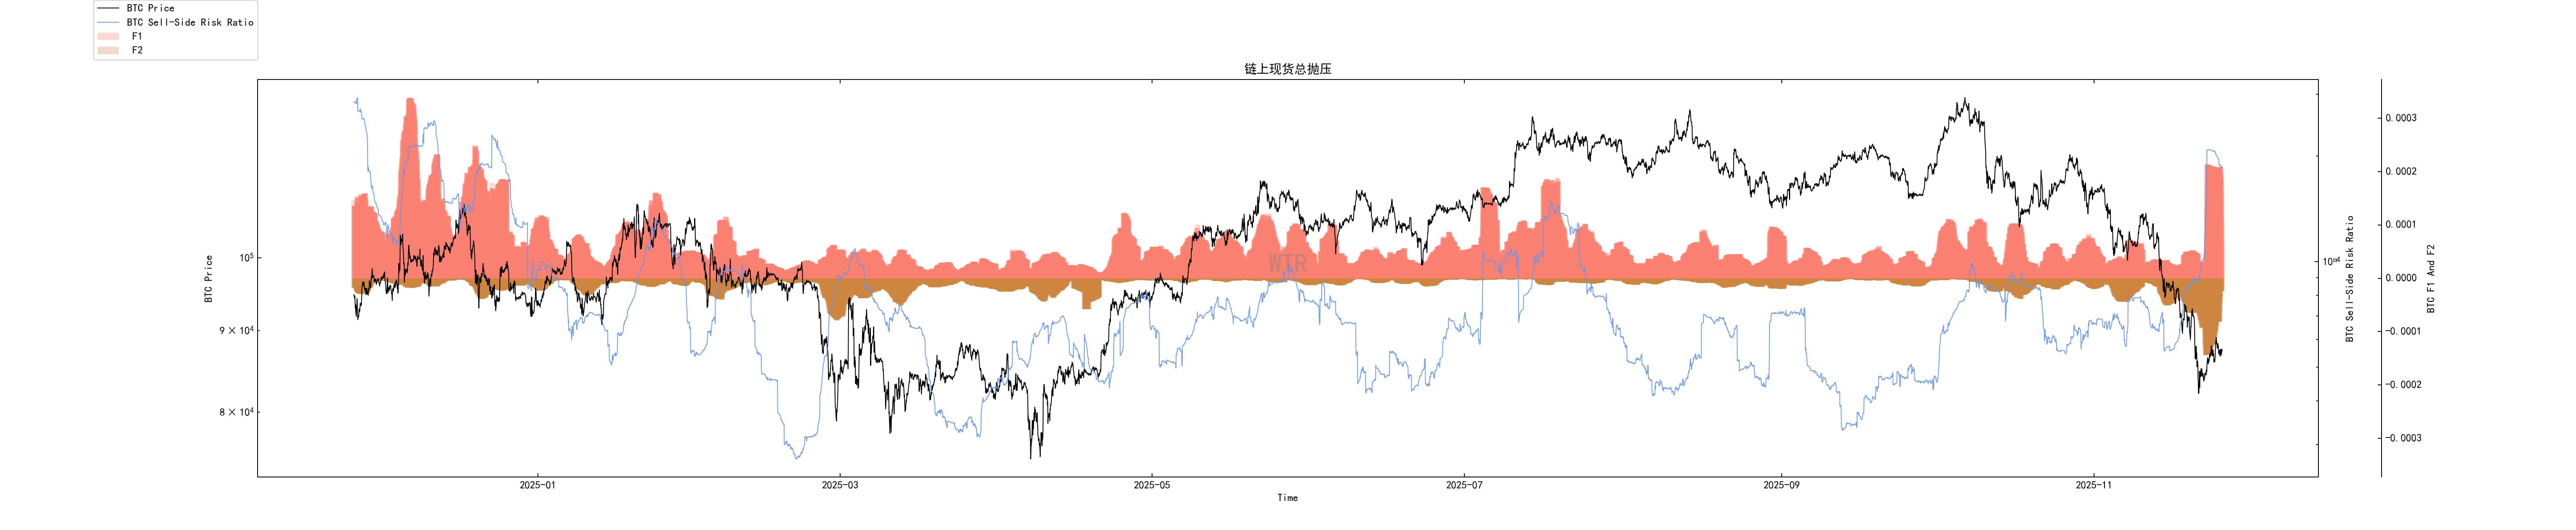
Prices fell from 91k to 80.6k, then rebounded to the 87–88k range, and the on-chain selling pressure index did not show a significant decline, instead remaining at moderately high levels.
This indicates that both types of selling are very active:
High-position profit positions have reduced holdings during rebounds;
Funds trapped during the plunge choose to exit as much as possible during rebounds.
This is not a structure where panic has ended, but a continuous clearing period after a peak:
The true deep bottom often sees the selling pressure index drop to extremely low levels: everything that could be sold has been accounted for;
The current state resembles a situation where every rebound is treated as a selling window, and sentiment is still digesting the previous round of greed.
The largest sell pressure spike comes from Coinbase address consolidation, which is statistical noise and directionless, but the overall upward trend is real.
BTC ETF net positions
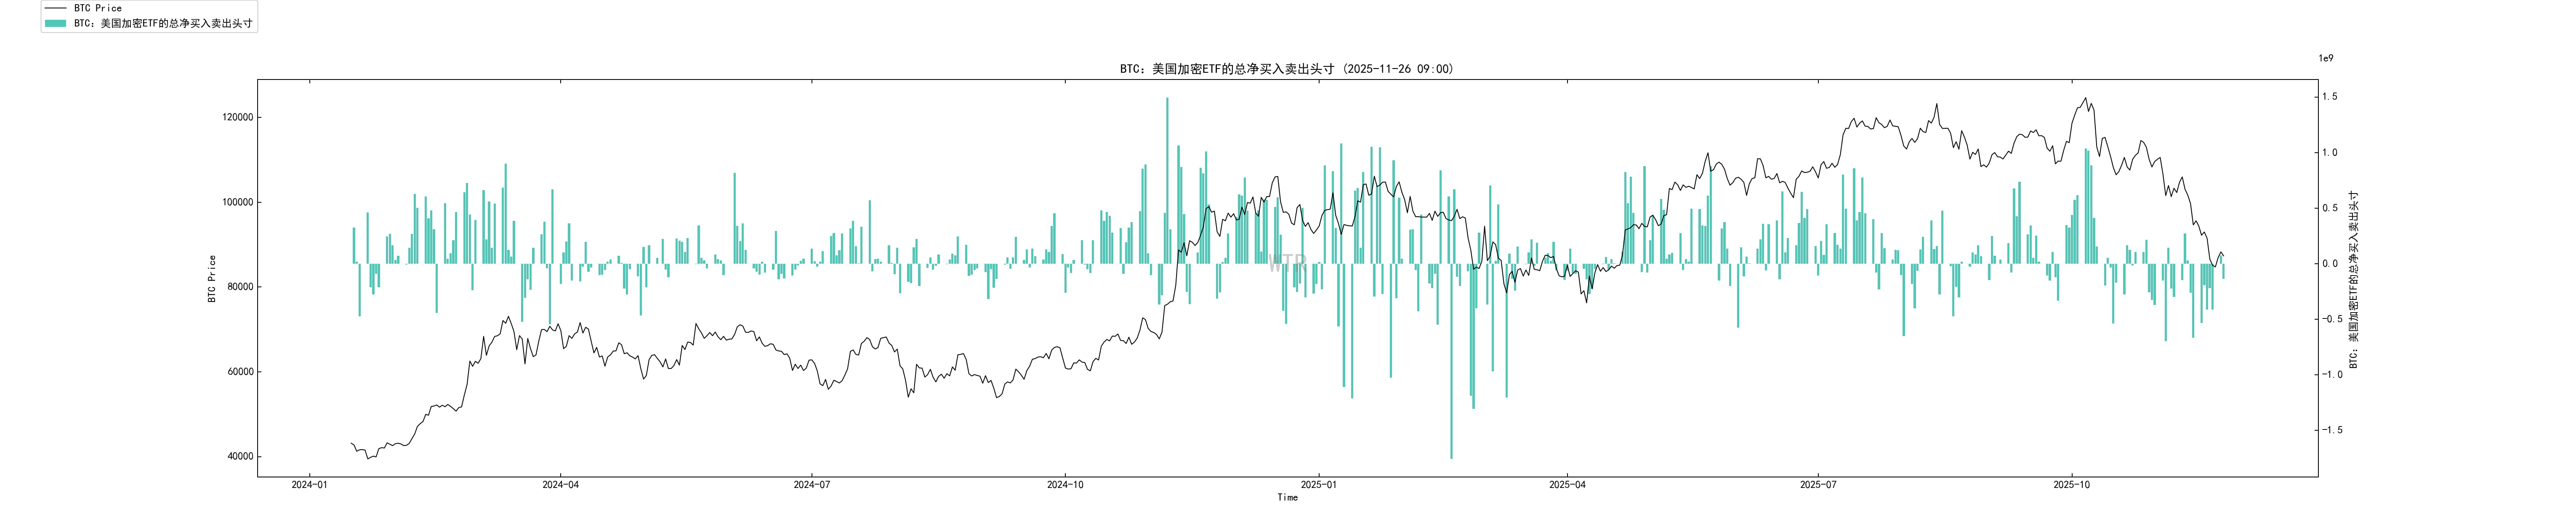
During the crash from 91k to 80.6k, ETF reserves continued to decline significantly, with capital leaving through redemptions.
This round of redemptions is not the behavior of retail investors panicking and fleeing when prices drop, but rather a systematic reduction after a comprehensive reassessment of macro and risk assets:
The Federal Reserve's rhetoric is wavering, and economic data is weakening;
Traditional institutions are unwilling to continue bearing duration risk on overvalued high-volatility assets.
Until around the day before yesterday, the net outflow of ETFs only slowed down significantly:
More like the selling pressure has come to a pause, switching to observation,
Far from a new round of accumulation.
Combining the news aspect
BTC spot ETF saw a net outflow of over a billion dollars last week, which aligns with the reserve decline shown in the graph.
Long-term holder term structure over six months
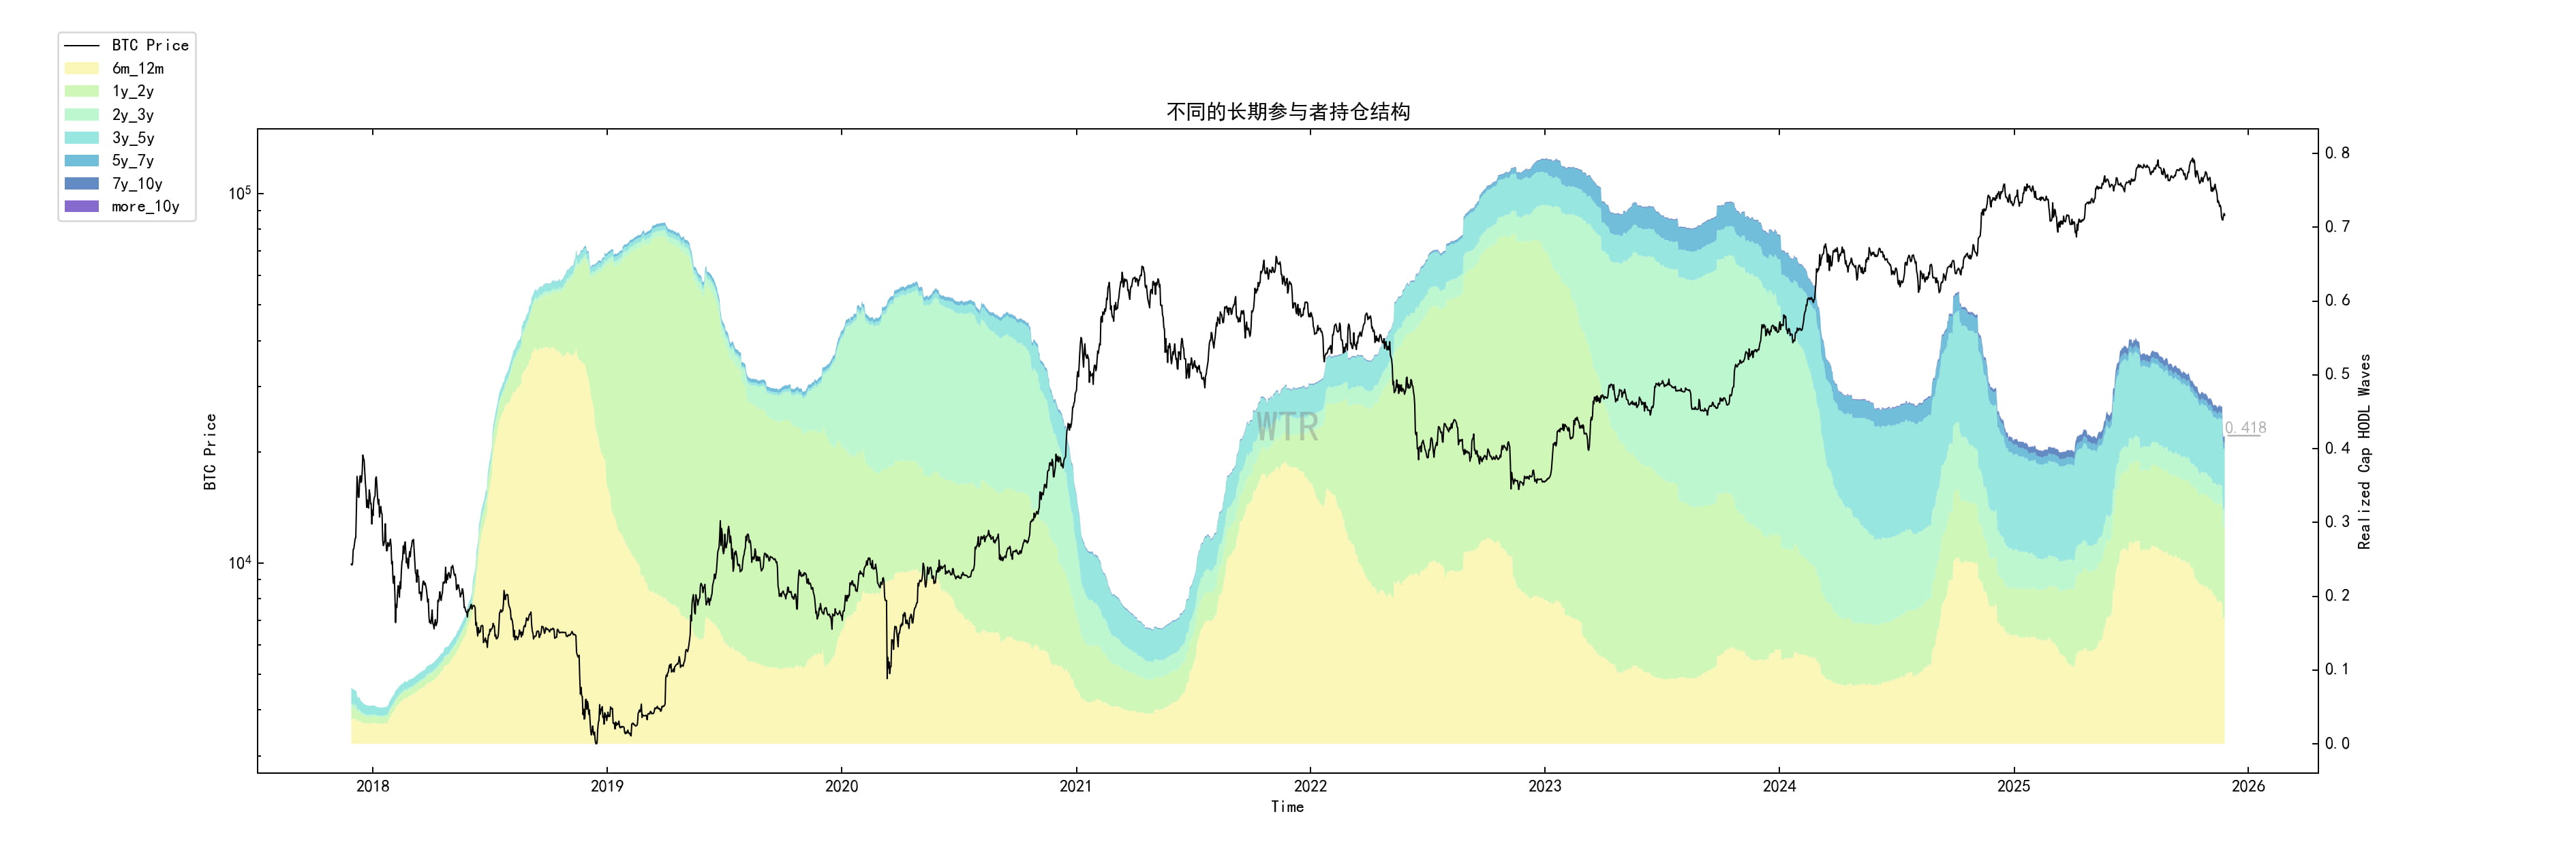
Two months ago, the supply ratio of holders with more than six months was around 52.7%; now, after excluding Coinbase noise, it is about 45.5–45.7%.
The decline is not small, indicating:
A portion of early long-term chips have already cashed out a considerable proportion during this round of market conditions above $100,000;
However, at the same time, nearly half of the chips are locked in the hands of long-term holders, which is completely different from the typical collapse of long-term chip ratios in the mid-to-late bear market.
The shape of the term structure also indicates:
Extremely old ultra-long chips (over 5 years, over 10 years) are slowly shrinking in proportion;
Middle-aged chips in the 1–3 year range have become the main force.
The latest drop from 0.457 to 0.418 is primarily due to technical disturbances from Coinbase address reorganization and should not be interpreted as a sudden collapse of long-term chips.
Large net transfers from exchange whales
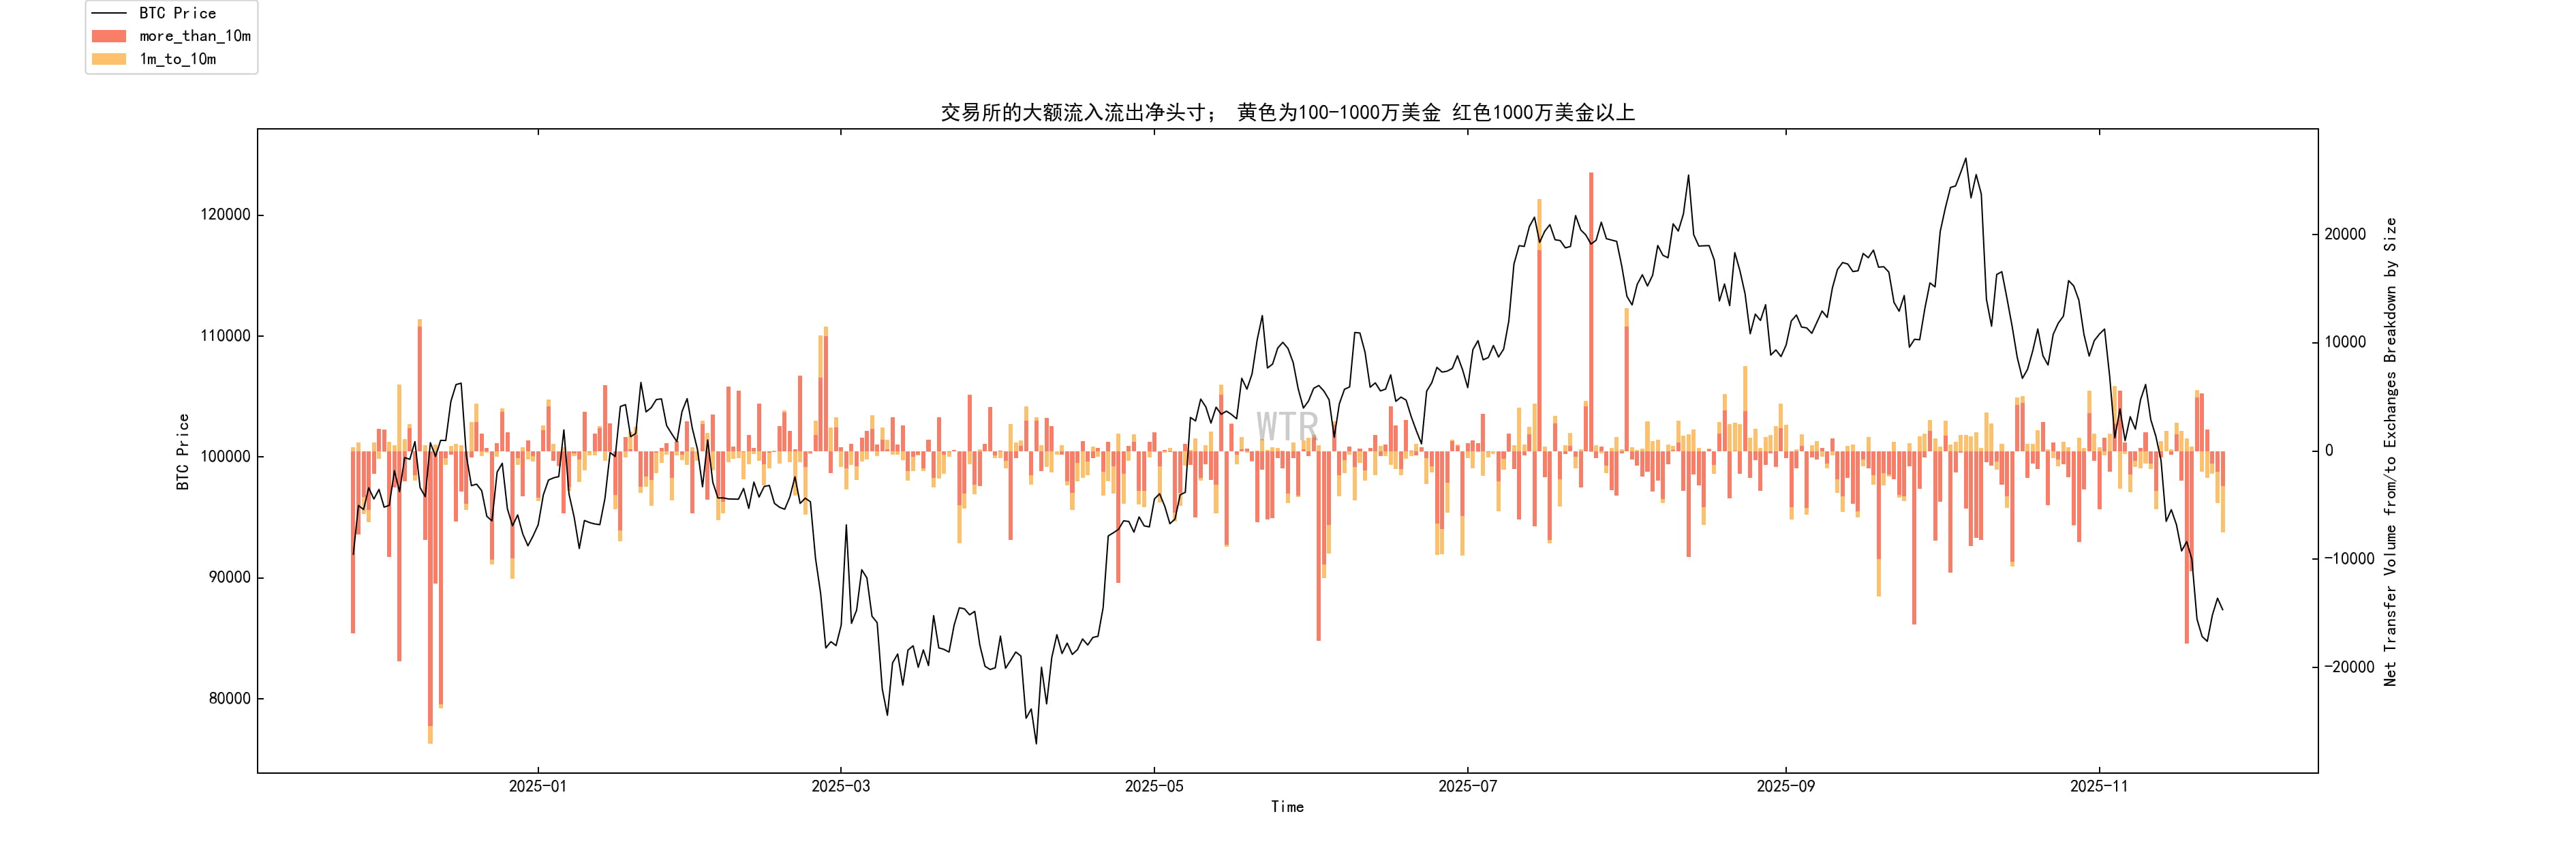
Three months ago at a high point:
There are significant inflows and outflows simultaneously, but inflows are slightly more.
In plain terms, there are more whales willing to send chips to exchanges, overall selling pressure is elevated.
After breaking below 90k:
A large amount of significant net outflows (withdrawals) indicates that a batch of whales views this as an attractive buying point, buying and then withdrawing.
Continues to fall to around 88k:
Some of the whales trying to buy the bottom started selling in reverse, and the price was subsequently smashed to $80.6k;
This indicates that this is not an infinite anti-fall long-term layout, but rather short-term funds with limited tolerance for drawdown.
After the sharp drop to 80.6k:
Prices warmed up to around $84k, and whales clearly no longer continued to dump.
Recently, cautious large withdrawals have appeared again in the 86–88k range, with capital testing for buying.
Overall, this chart does not show that whales are uniformly bearish or bullish, but a continuous game between large funds:
Some are catching flying knives above 90k, while others are only willing to slowly absorb at 80k or even lower.
There are also those who are only willing to slowly absorb at 80k or even lower.
The 80–90k range is a battleground for significant funds to pass on to each other.
Cost line of short-term speculators
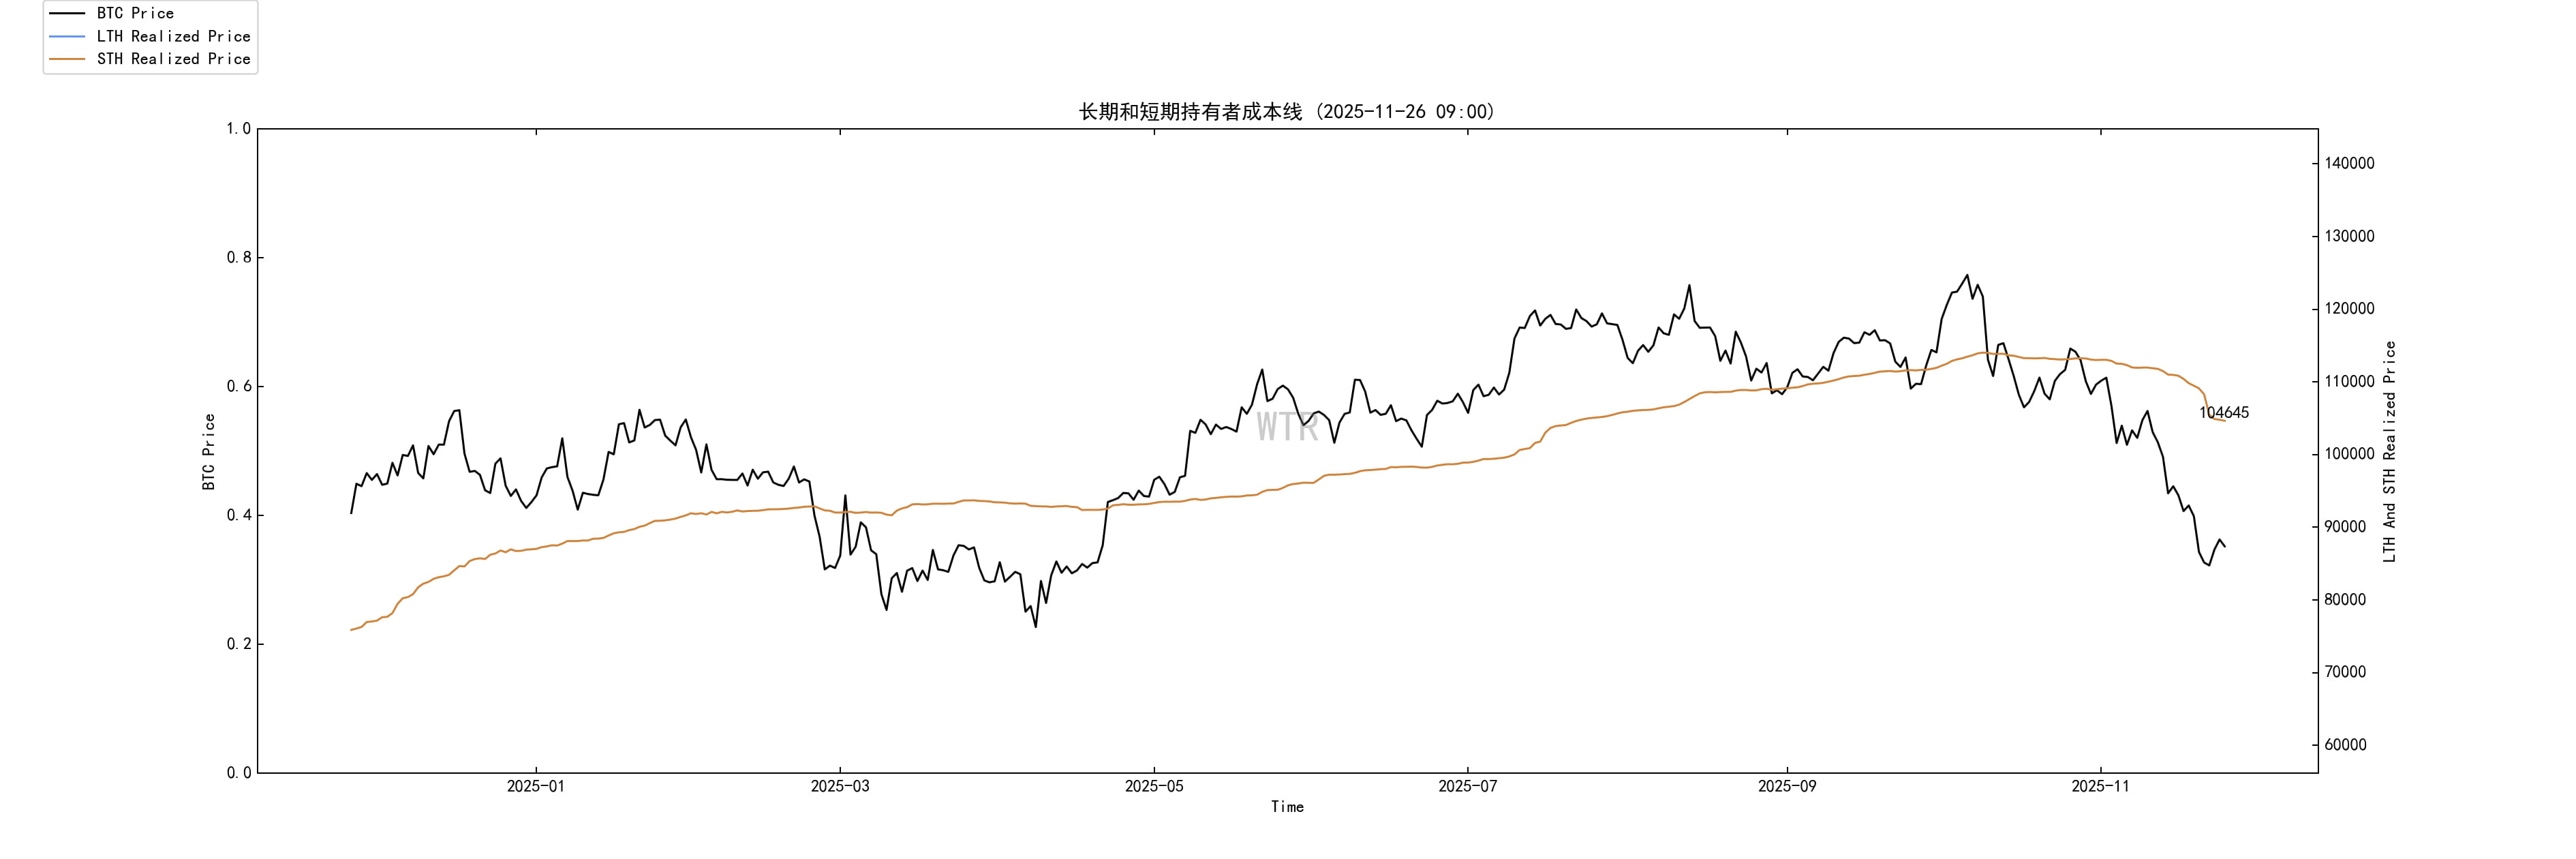
The average cost line for short-term holders has decreased from 111,968 → 109,821 → about 106,500 USD, showing a clear downward trend.
Current price has dropped to a minimum of $87,700, with the overall depth of short-term positions trapped.
The vast majority of chips bought in the last 3–6 months are in a state of floating loss;
Every time the price approaches this cost line, it triggers a round of liquidation selling.
The downward shift of the cost line itself indicates:
High-position short-term chips have been progressively cut during the plunge and rebound;
New purchases are happening in lower price ranges, with overall costs declining.
This is a typical mid-cycle adjustment state:
Far from being a short-term collective profit-making feast right after reaching a peak;
The final liquidation is not yet complete—the cost line is still far above the current price, indicating that the last round of thorough reshuffles has not been completed.
So:
Short-term chips are bleeding, while long-term chips are shifting, with the spot market in a layer where there are unwrapping positions above and tentative buying below.
Look at on-chain, ETFs, macro, and news together.
From an overall perspective, the characteristics of the current position are very distinct:
Macro: Shifting from anti-inflation to shadowy easing
Federal Reserve senior officials collectively dove, but this is not a victory announcement; rather, they are forced to consider employment and economic downturns before inflation fully returns to 2%.
Goldman Sachs mentioned the increase in layoffs, indicating that the weakness in the labor market is solidifying; this is a typical sign before a recession.
At the same time, the US is relaxing bank regulations, releasing $2.6 trillion in loan space, and Logan also mentioned that the balance sheet will return to expansion, which means:
→ The policy level is trying to use looser financial conditions to hedge against the weakness of the real economy.
This set of combinations does not simply mean a bullish or bearish outlook for BTC, but rather:
Liquidity may gradually loosen, but the premise is to acknowledge economic issues.
Risk assets will first experience a round of 'valuation repricing' before discussing a new round of festivity.
Traditional funds: ETFs vote with their feet
BTC spot ETF is the most direct channel for traditional funds to express their attitudes, with a net outflow of $1.2 billion last week; ETH also accumulated an outflow of $500 million, while SOL ETF continued to see net inflows.
This indicates two points:
From the perspective of compliant funds, Bitcoin is in a phase of reduction rather than accumulation;
Funds are not leaving crypto altogether but are undergoing structural rotation.
Again, in conjunction with the changes in ETF in Graph 3:
→ The attitude of traditional funds is very simple:
Short-term withdraw part of BTC positions, reassess macro and return-risk ratio; meanwhile, use a small amount of capital to bet on assets with higher elasticity.
On-chain stock funds: Old chips cashing out, new capital taking over
Integrating the previous six indicators gives a similarly clear picture:
Non-liquid long-term whales have shifted from net buying to net selling;
The proportion of long-term chips held for over six months has dropped from 52.7% to 45.x%, with old coins continuing to flow out;
Exchange whales have been flowing in at high positions, attempting to buy near $90k, giving up part at $88k, and starting a new round of tentative buying near $80k;
Short-term positions are overall deeply trapped, with cost lines far above current prices;
On-chain spot selling pressure remains moderately high.
The chips accumulated from the last round of major increases are now being transferred from OG long-term holders and high-position retail investors to new capital that values liquidity and risk control more.
Cryptocurrency is moving from a casino to a financial infrastructure + high-risk growth assets.
This is also why, even if BTC adjusts, SOL, AI-related chains, and RWA narratives still see new funds continuously emerging.
Outlook: Short-term and mid-long-term
Short-term: High-position oscillation clearing, direction undetermined but risk preference downward
Combining on-chain and macro data, the short-term structure is roughly as follows:
Selling pressure has not ended:
On-chain total selling pressure is moderately high;
Non-liquid long-term whales are still selling;
Short-term positions are widely trapped, with obvious unwrapping selling pressure above.
Traditional funds have not turned back:
ETFs are only slowing outflows, with no significant net inflows appearing;
This means that compliant funds are not yet ready to endorse the new trend.
Large funds are gaming in the 80–90k range:
Whales are testing the bottom while also potentially reducing their positions during rebounds;
Back and forth washing within the range is a high-probability scenario.
In this structure, what is more likely to be seen in the short term is:
Severe volatility and frequent false breakthroughs;
Any rebounds close to previous cost-intensive areas (near STH cost line) will encounter significant selling pressure;
If another round of poor macro data + officials turning hawkish occurs,
The risk of breaking below the previous low and retesting 80k or even lower cannot be ignored.
Medium to long-term: Reallocation after mid-cycle adjustment, or the beginning of a new bear market?
Here, two paths must be split for discussion.
Path A: Mid adjustment at a high position, then restarting upward in a loose environment (currently with a higher weight)
Prerequisite assumptions:
The Federal Reserve will eventually enter a gradual rate cut as expected, with the economy slowing but not collapsing;
The credit expansion brought about by the relaxation of bank regulations has partially been realized;
AI investment and the institutionalization of digital assets continue to advance, without being reversed by large-scale policies.
In this situation:
The current round of clearing will remove a large number of high-position short-term chips and some old chips from the system;
The proportion of long-term chips may stabilize around 40–45%, with a new generation of long-term holders beginning to form;
The ETF outflow phase has come to a close, gradually transitioning to mild net inflows;
AI, public chain computing power, RWA, and other directions continue to attract institutional allocations, turning BTC into a more standard 'risk asset benchmark + digital gold hybrid'.
The result of this path is:
This is a major reshuffle in the later stage of a bull market, rather than the end of a full cycle.
A true long-term top will wait until mainstream capital collectively loses risk awareness again in a new round of easing.
Path B: Macro hard landing, currently just the prologue of a new bear market (requires continuous monitoring)
Prerequisite assumptions:
Employment and credit indicators continue to worsen, forcing the Federal Reserve to cut rates sharply in a worse economic environment;
The financial system has experienced localized accidents, leading to a valuation kill of risk assets.
In this path:
ETFs are expected to experience longer and larger continuous outflows;
The reductions of non-liquid whales and long-term holders will shift from rhythmic to capitulatory;
The proportion of long-term chips will further dip to 30% or even lower;
The STH cost line will be repeatedly crushed, and a new generation of retail investors and pseudo-long-term holders will be completely washed out.
Currently, there are no extreme signals on-chain, but at the macro level, such evolution cannot be ruled out, so this path must be kept in mind as a tail risk to guard against.
Mid-term exploration
Short-term profit percentage compound model
Whale comprehensive score
USDC purchasing power comprehensive score
Total chip distribution on-chain
Realized profit and loss net positions
Cost structure analysis
Incremental model
(Below is the short-term profit percentage compound model)
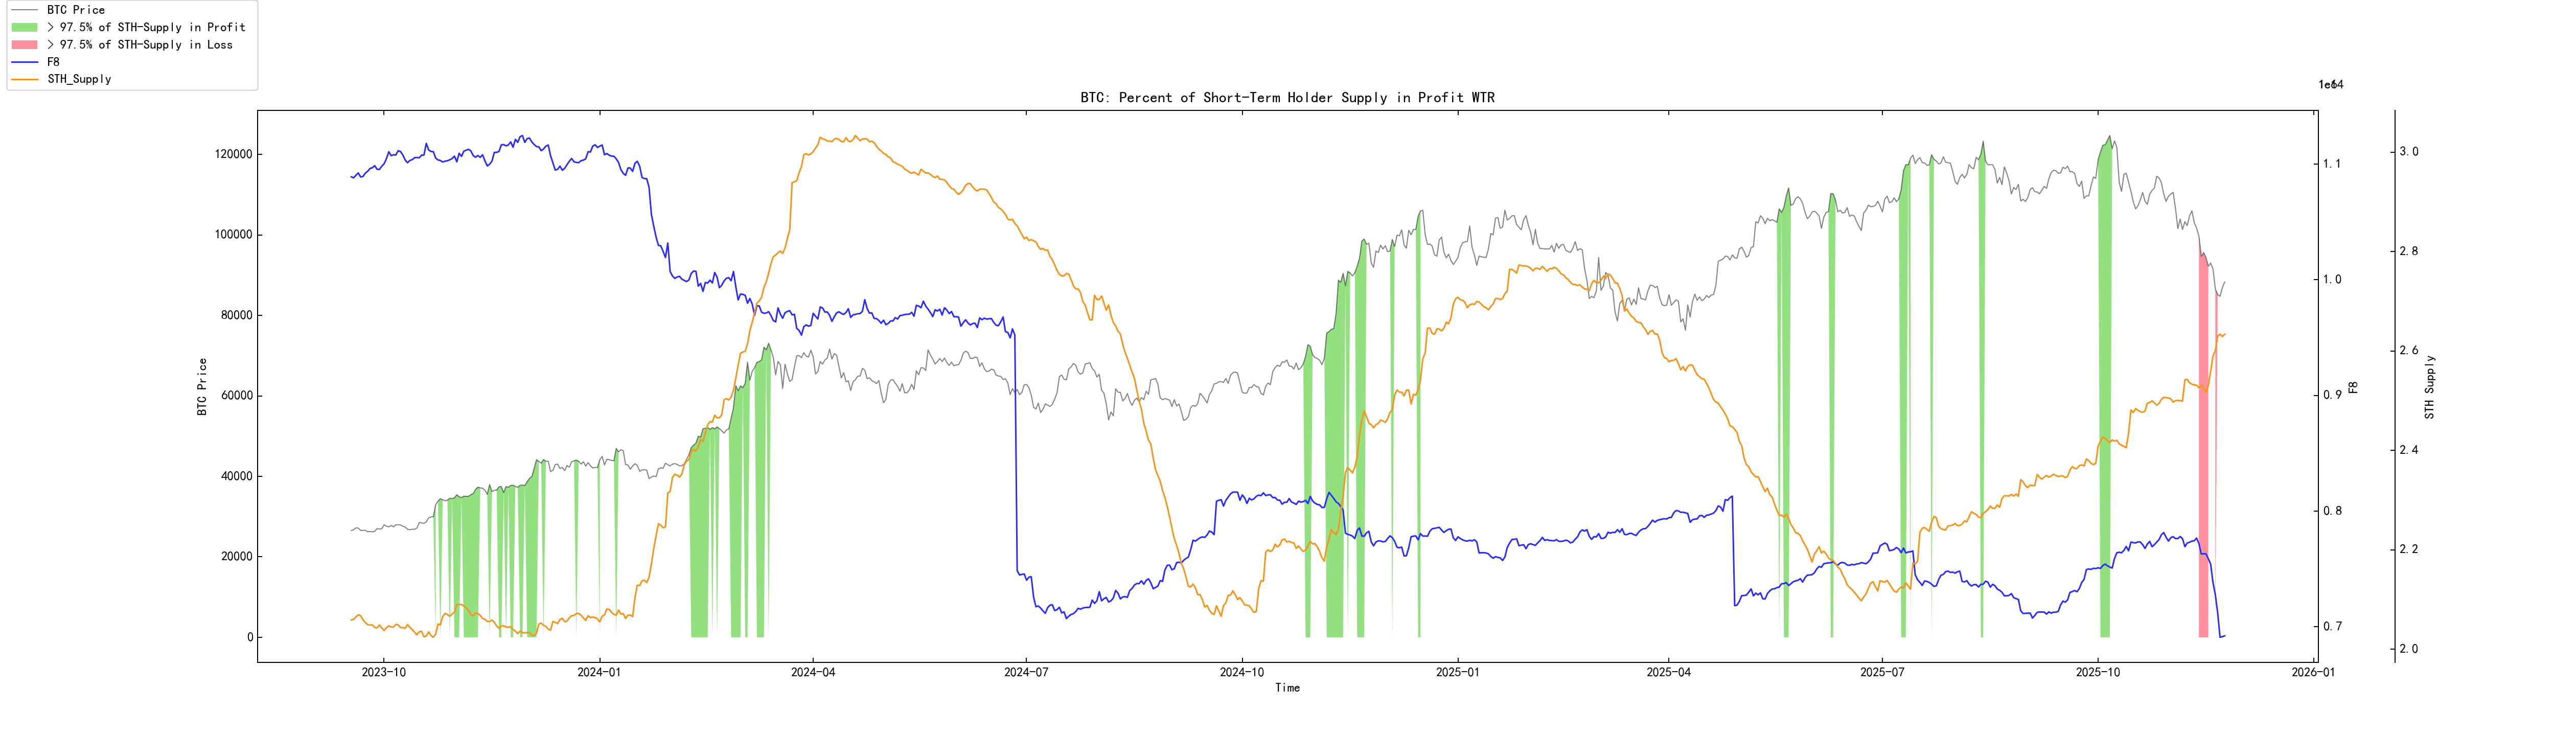
The current market is continuously processing the extreme loss areas of short-term participants, and the liquidity loss shocks that erupted in this state have been released twice.
The state of short-term participants is no longer the main force facing continuous shocks in the market.
(Below is the comprehensive score of whales)
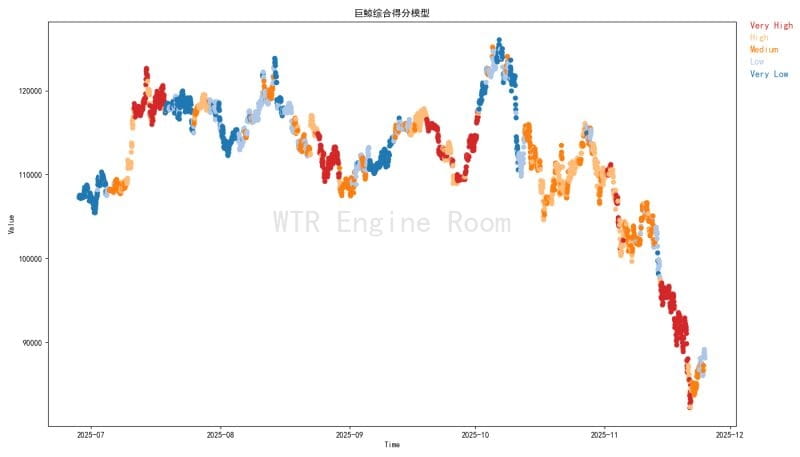
Whales' current score has decreased, and the solid support force in the market has weakened.
This group may have become cautious when the market slightly improves.
(Below is the comprehensive score of USDC purchasing power)
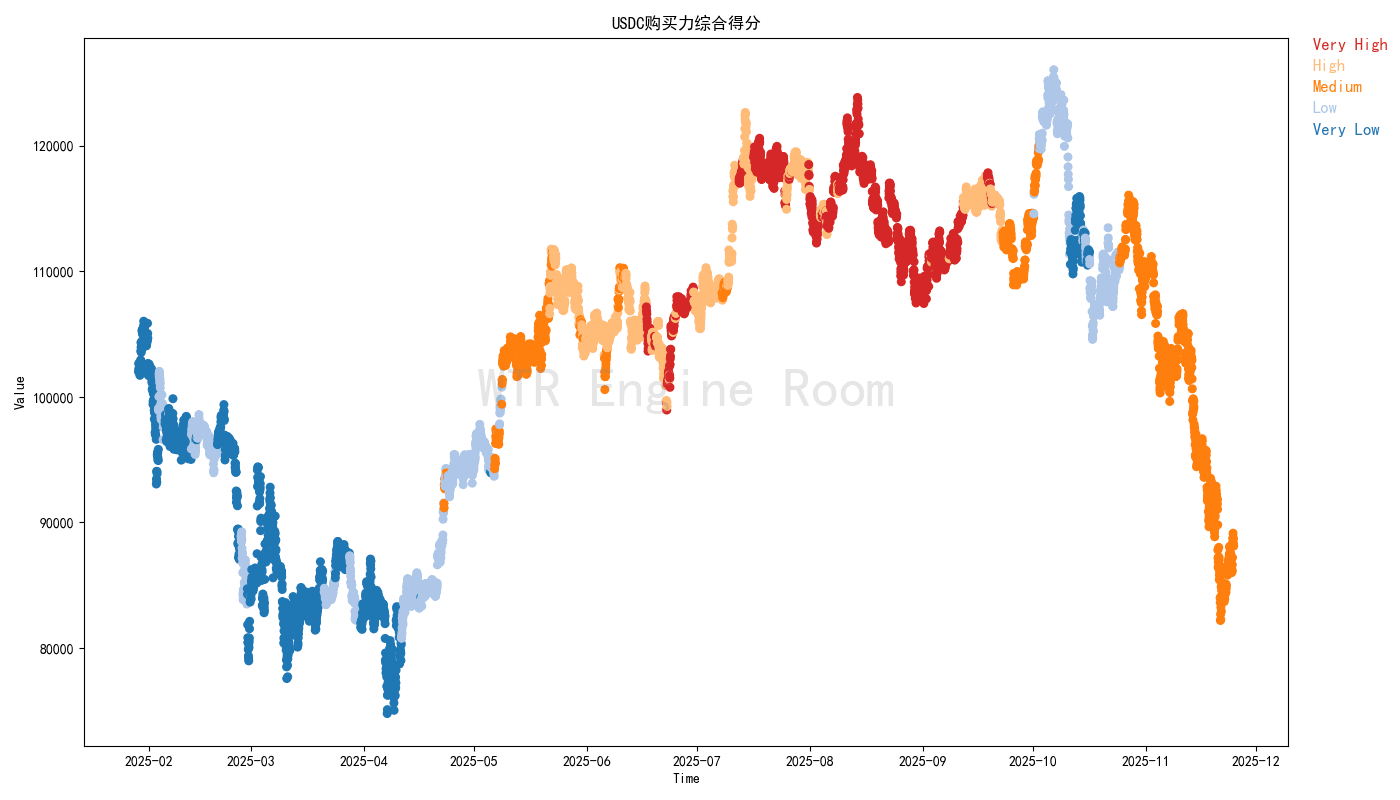
The buyers of USDC are still close to a neutral participation attitude, with scores close to 'medium'.
(Below is the total chip distribution on-chain)
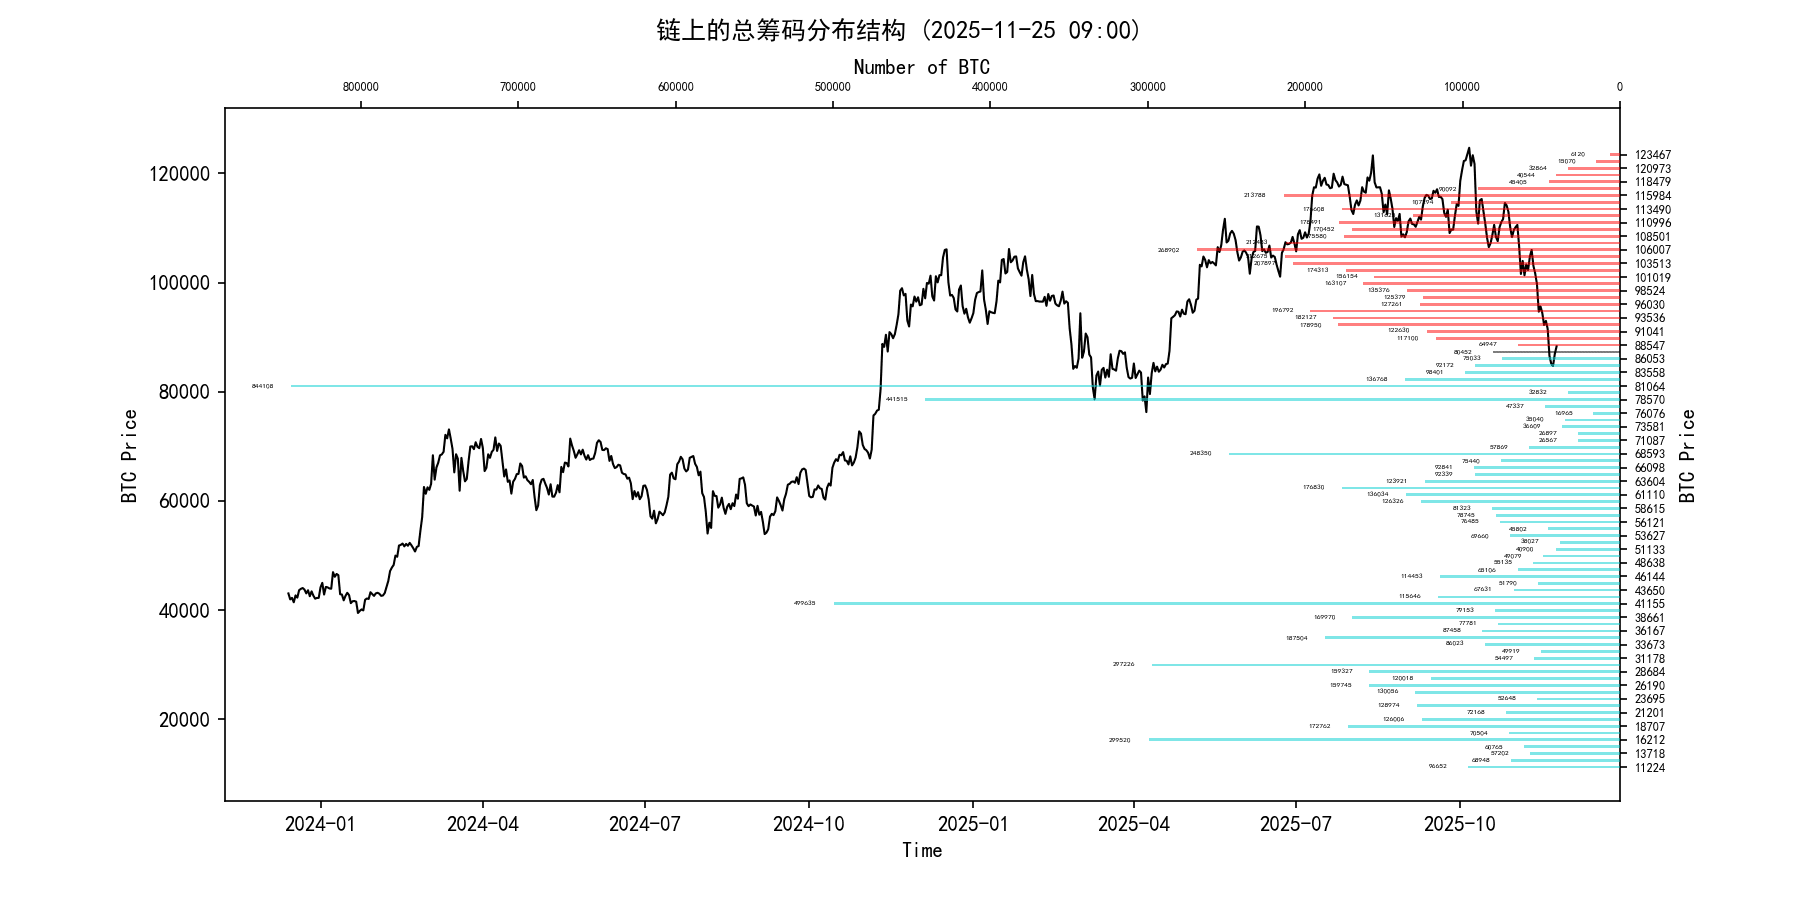
Currently, the weak area of chips at 82,000 is increasing, which may form a new transaction area nearby. The market is still facing potential unwrapping pressure around 91,000-115,000.
In an optimistic state, the market may gradually change hands in the area around 83,000-84,000, keeping pricing stable and gradually digesting pressure.
If the market is still in a state of shock from losing chips, pricing may be in an unstable state.
(Below is the realized profit and loss ratio net position)
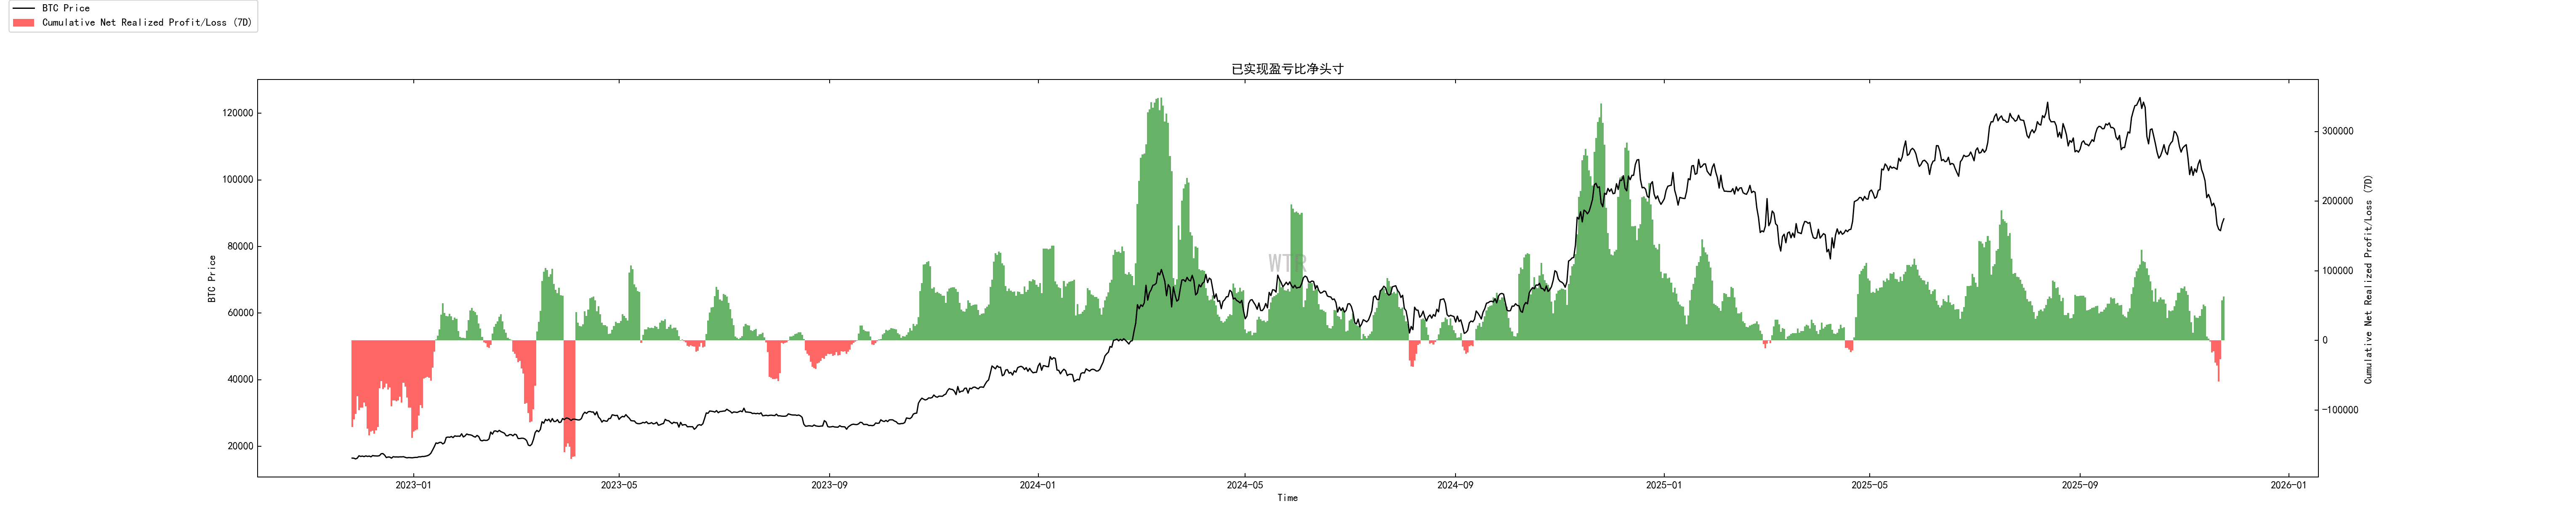
The market is hovering between profit transactions and loss transactions. It is in a composite area of overlapping risks, and once a price collapse occurs during the process of digesting loss chips, market secondary pricing may drop below the stable transaction zone of chips, potentially forming a new round of stampedes.
(Below is the cost structure analysis)
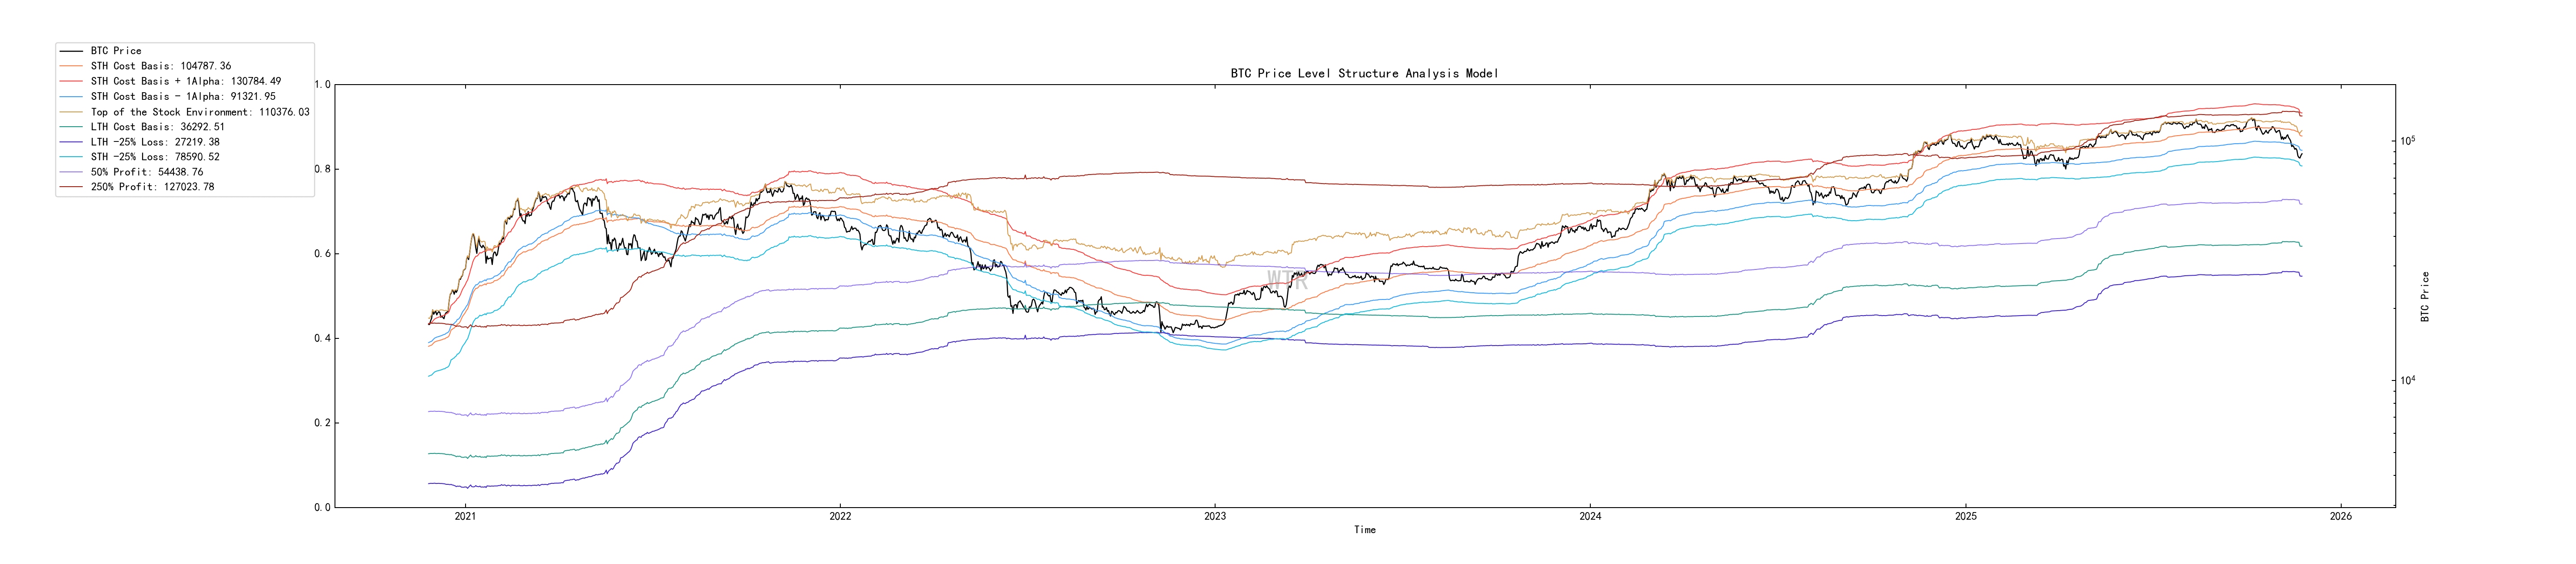
STH-Alpha is currently priced at around 91,300, which is the lower limit of the liquidity active area for short-term participants. The current market pricing is below this lower limit, suggesting that the current positioning may lean towards a consolidation period, and the structure of market participants will be restructured.
STH -25% is currently around $78,500, possibly due to a shift in market conditions and new liquidity injections, allowing the market to gain new support.
(Below is the incremental model)
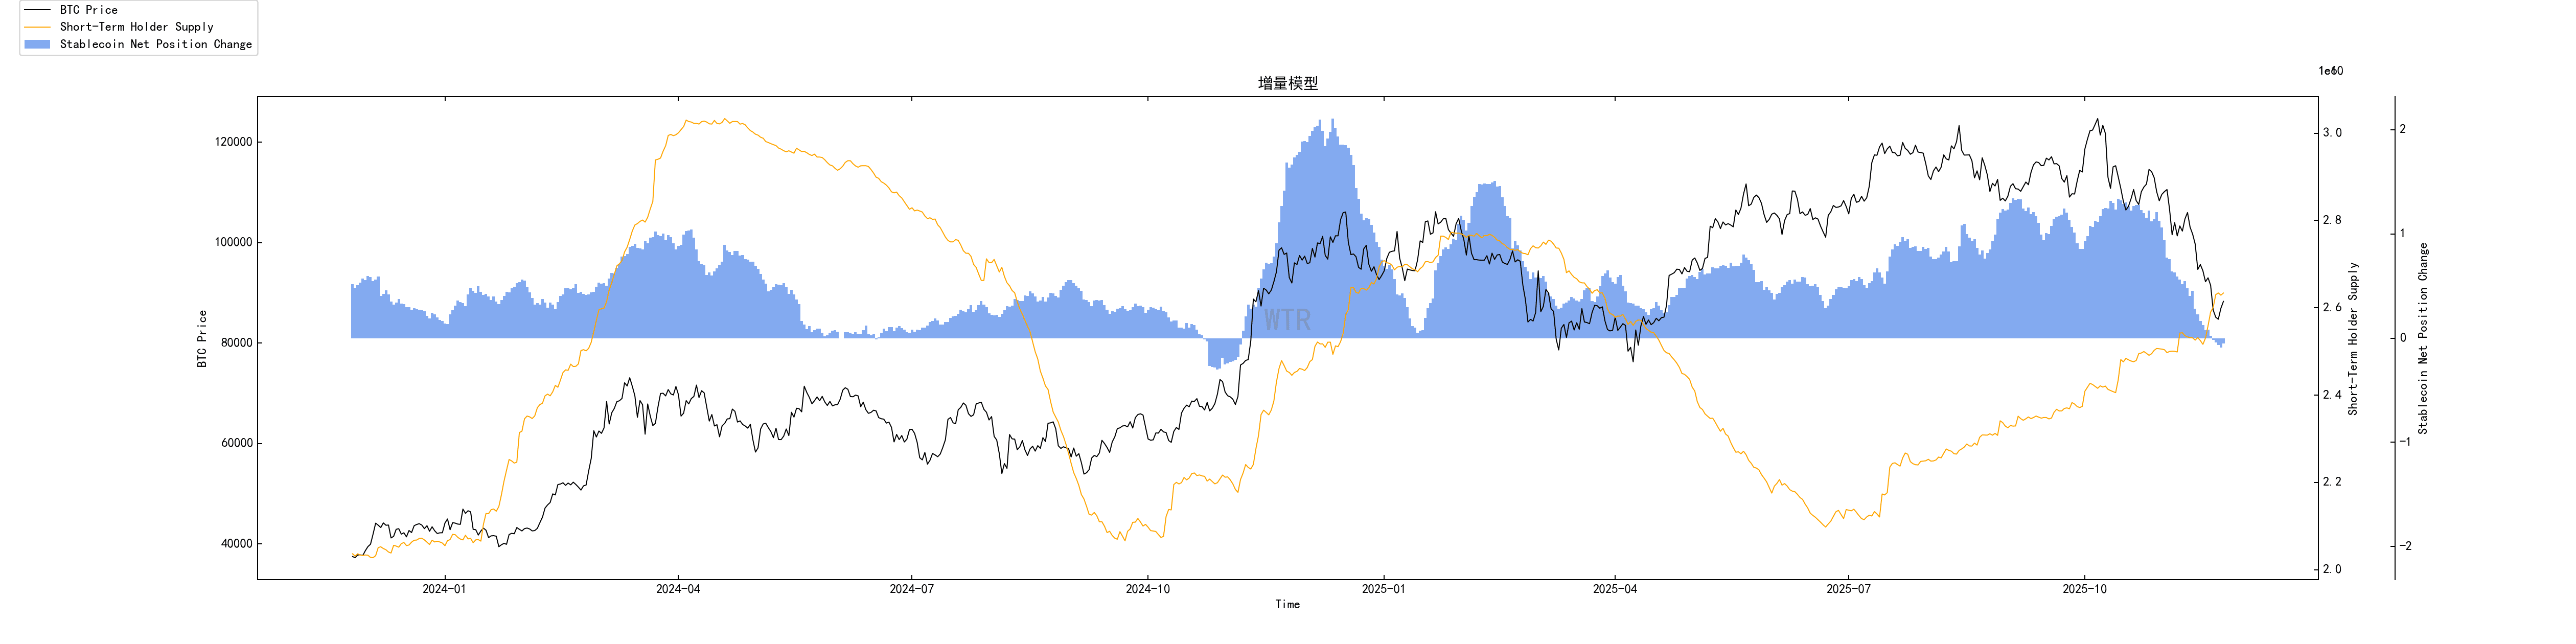
New funds are injected into the market, but the current pace of participation has also slowed.
Short-term observation
Derivatives risk coefficient
Options intent trading ratio
Derivatives trading volume
Options implied volatility
Profit and loss transfer volume
New addresses and active addresses
Net positions of Ice Sugar Orange Exchange
Net positions of Aita exchange
High-weight selling pressure
Global purchasing power status
Net positions of stablecoin exchanges
Derivatives rating: Risk coefficient is in a neutral area, with moderate derivative risk.
(Below is the derivatives risk coefficient)
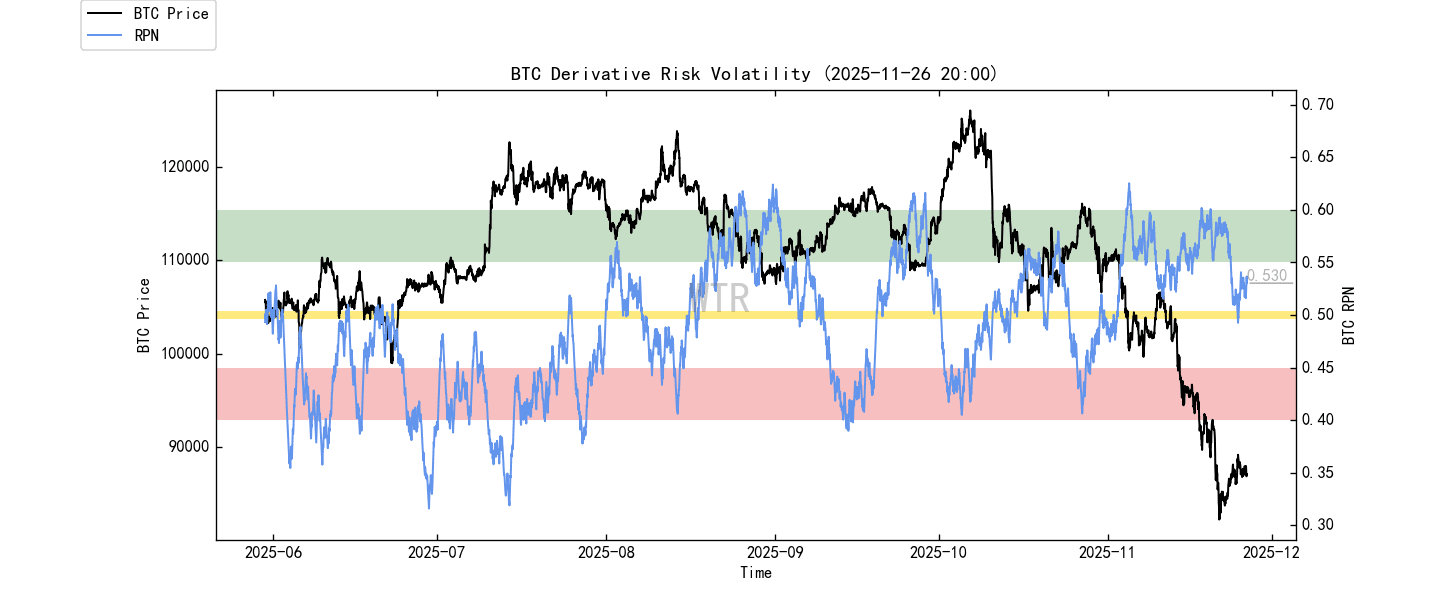
The weak rebound expected last week saw the market probing lower again before the rebound arrived, and it has temporarily stopped falling. The derivatives risk coefficient is now in a neutral area. Currently, the market is more affected by spot trading, and it is expected to be in a slight downward or volatile mode this week.
(Below is the options intent trading ratio)
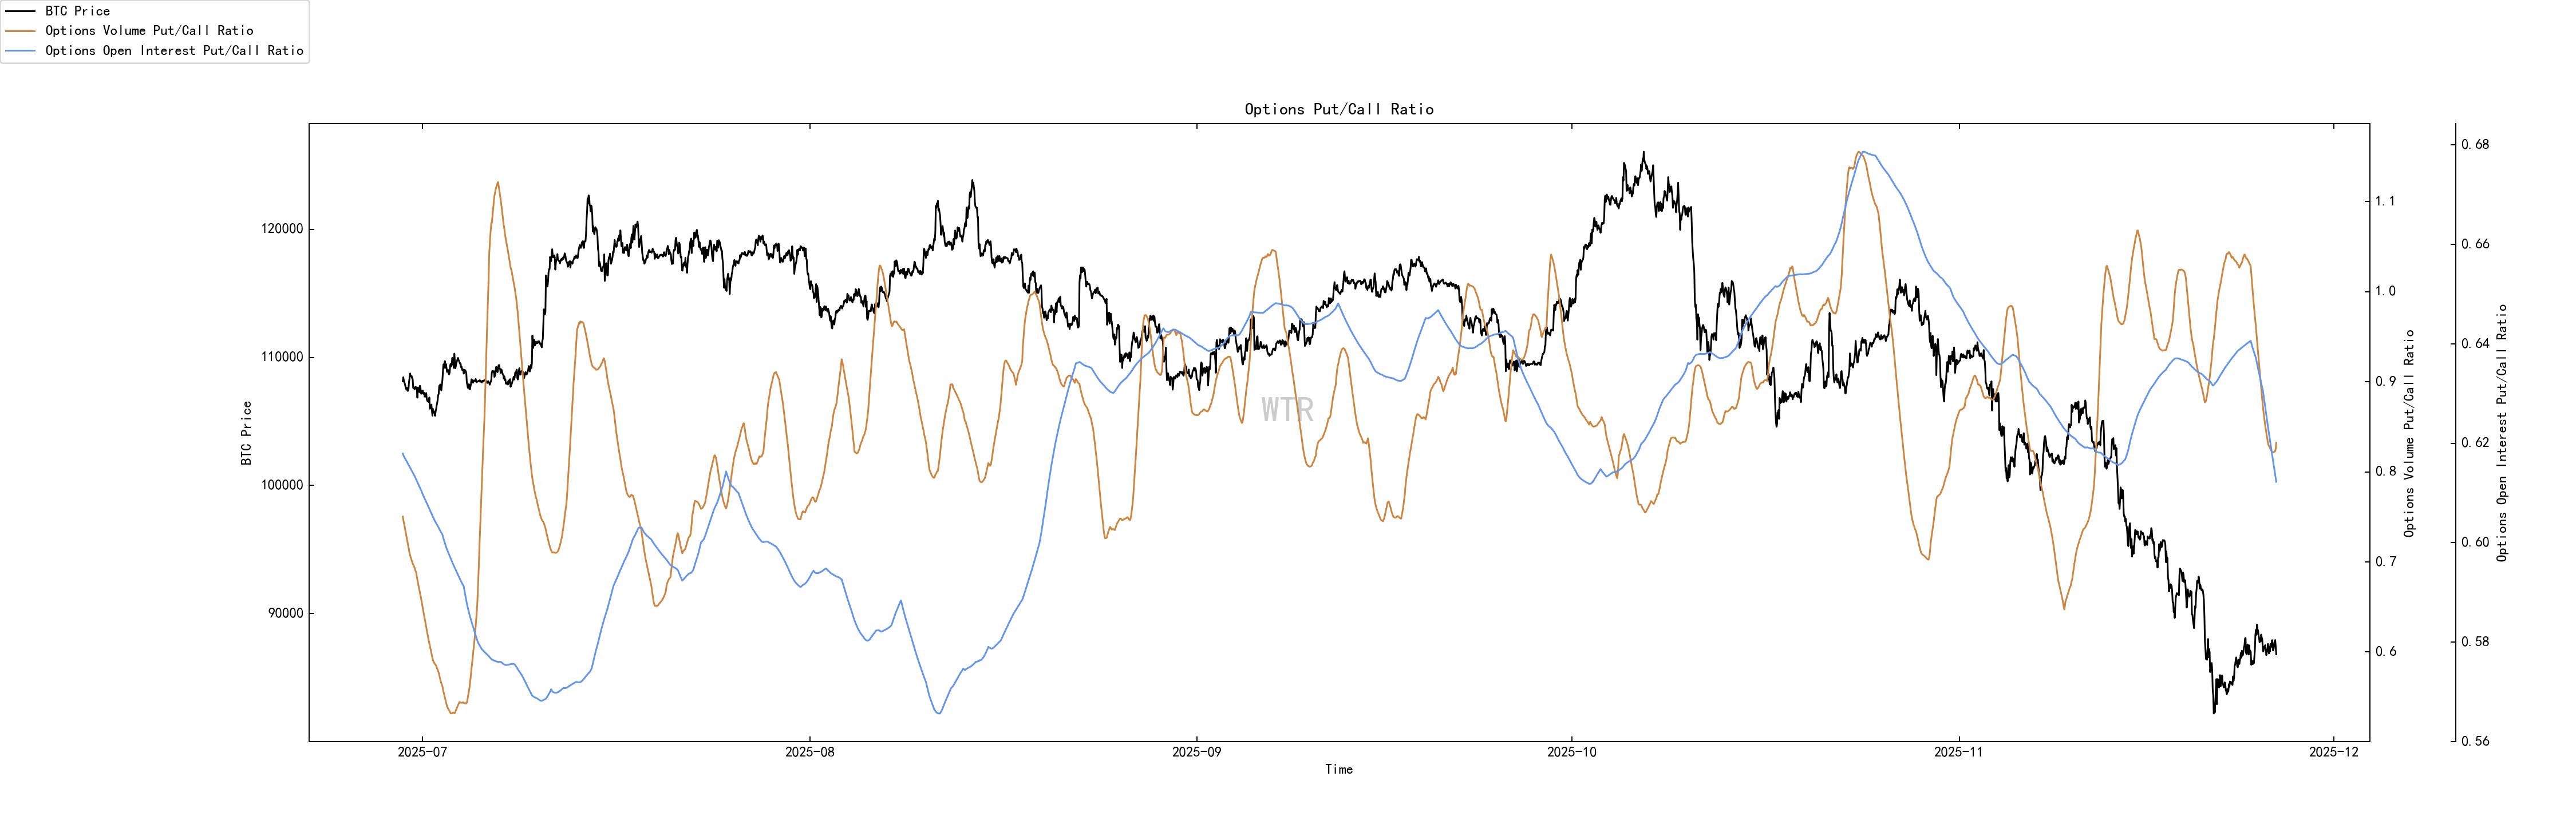
The proportion of bearish options has slightly decreased, overall in the median.
(Below is the derivatives trading volume)
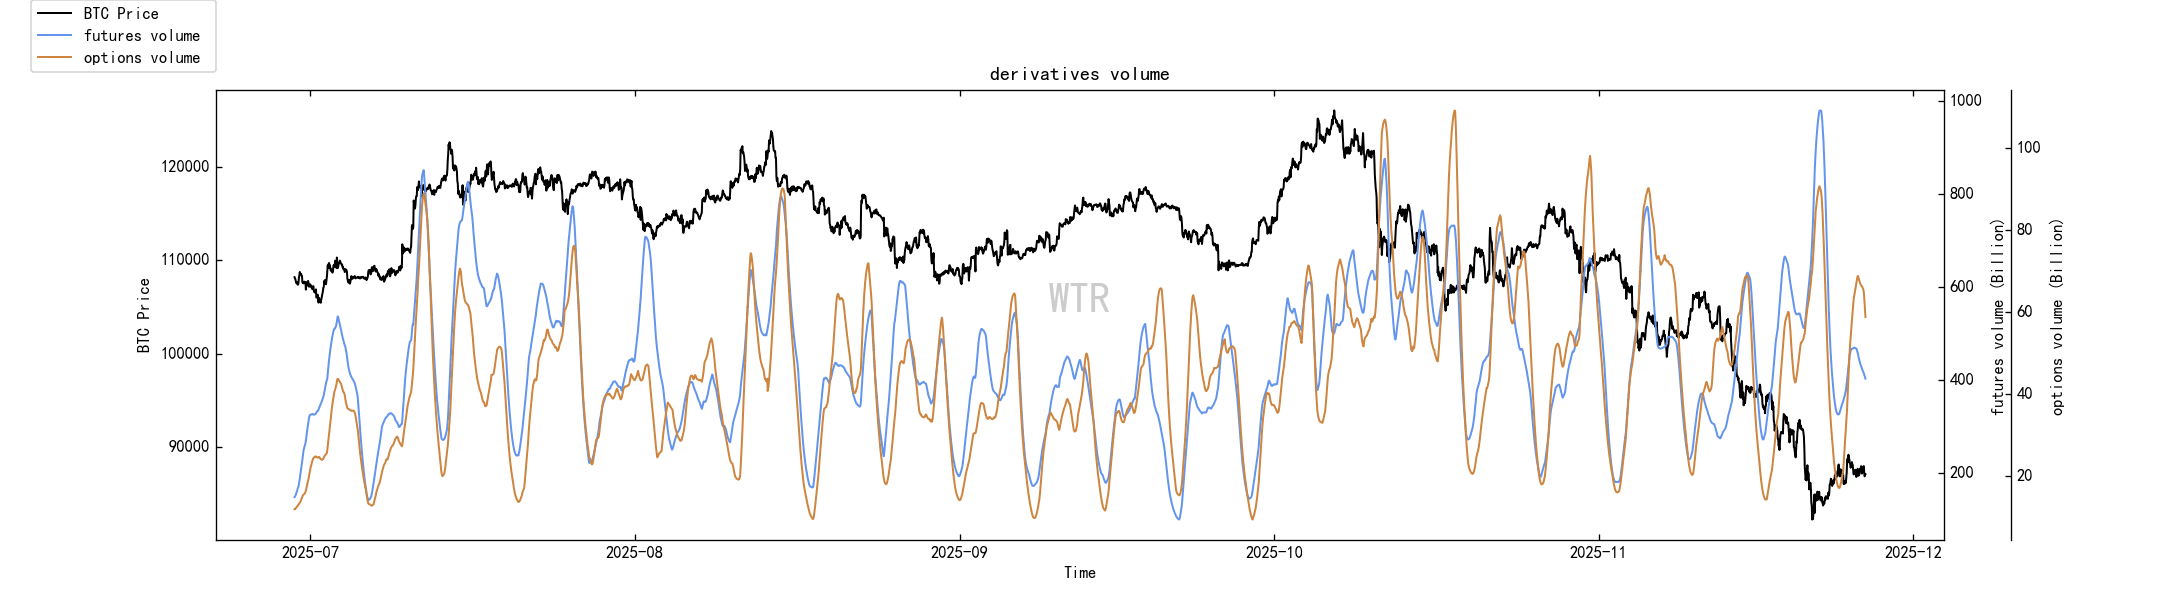
Derivatives trading volume is currently at the median.
(Below is the options implied volatility)
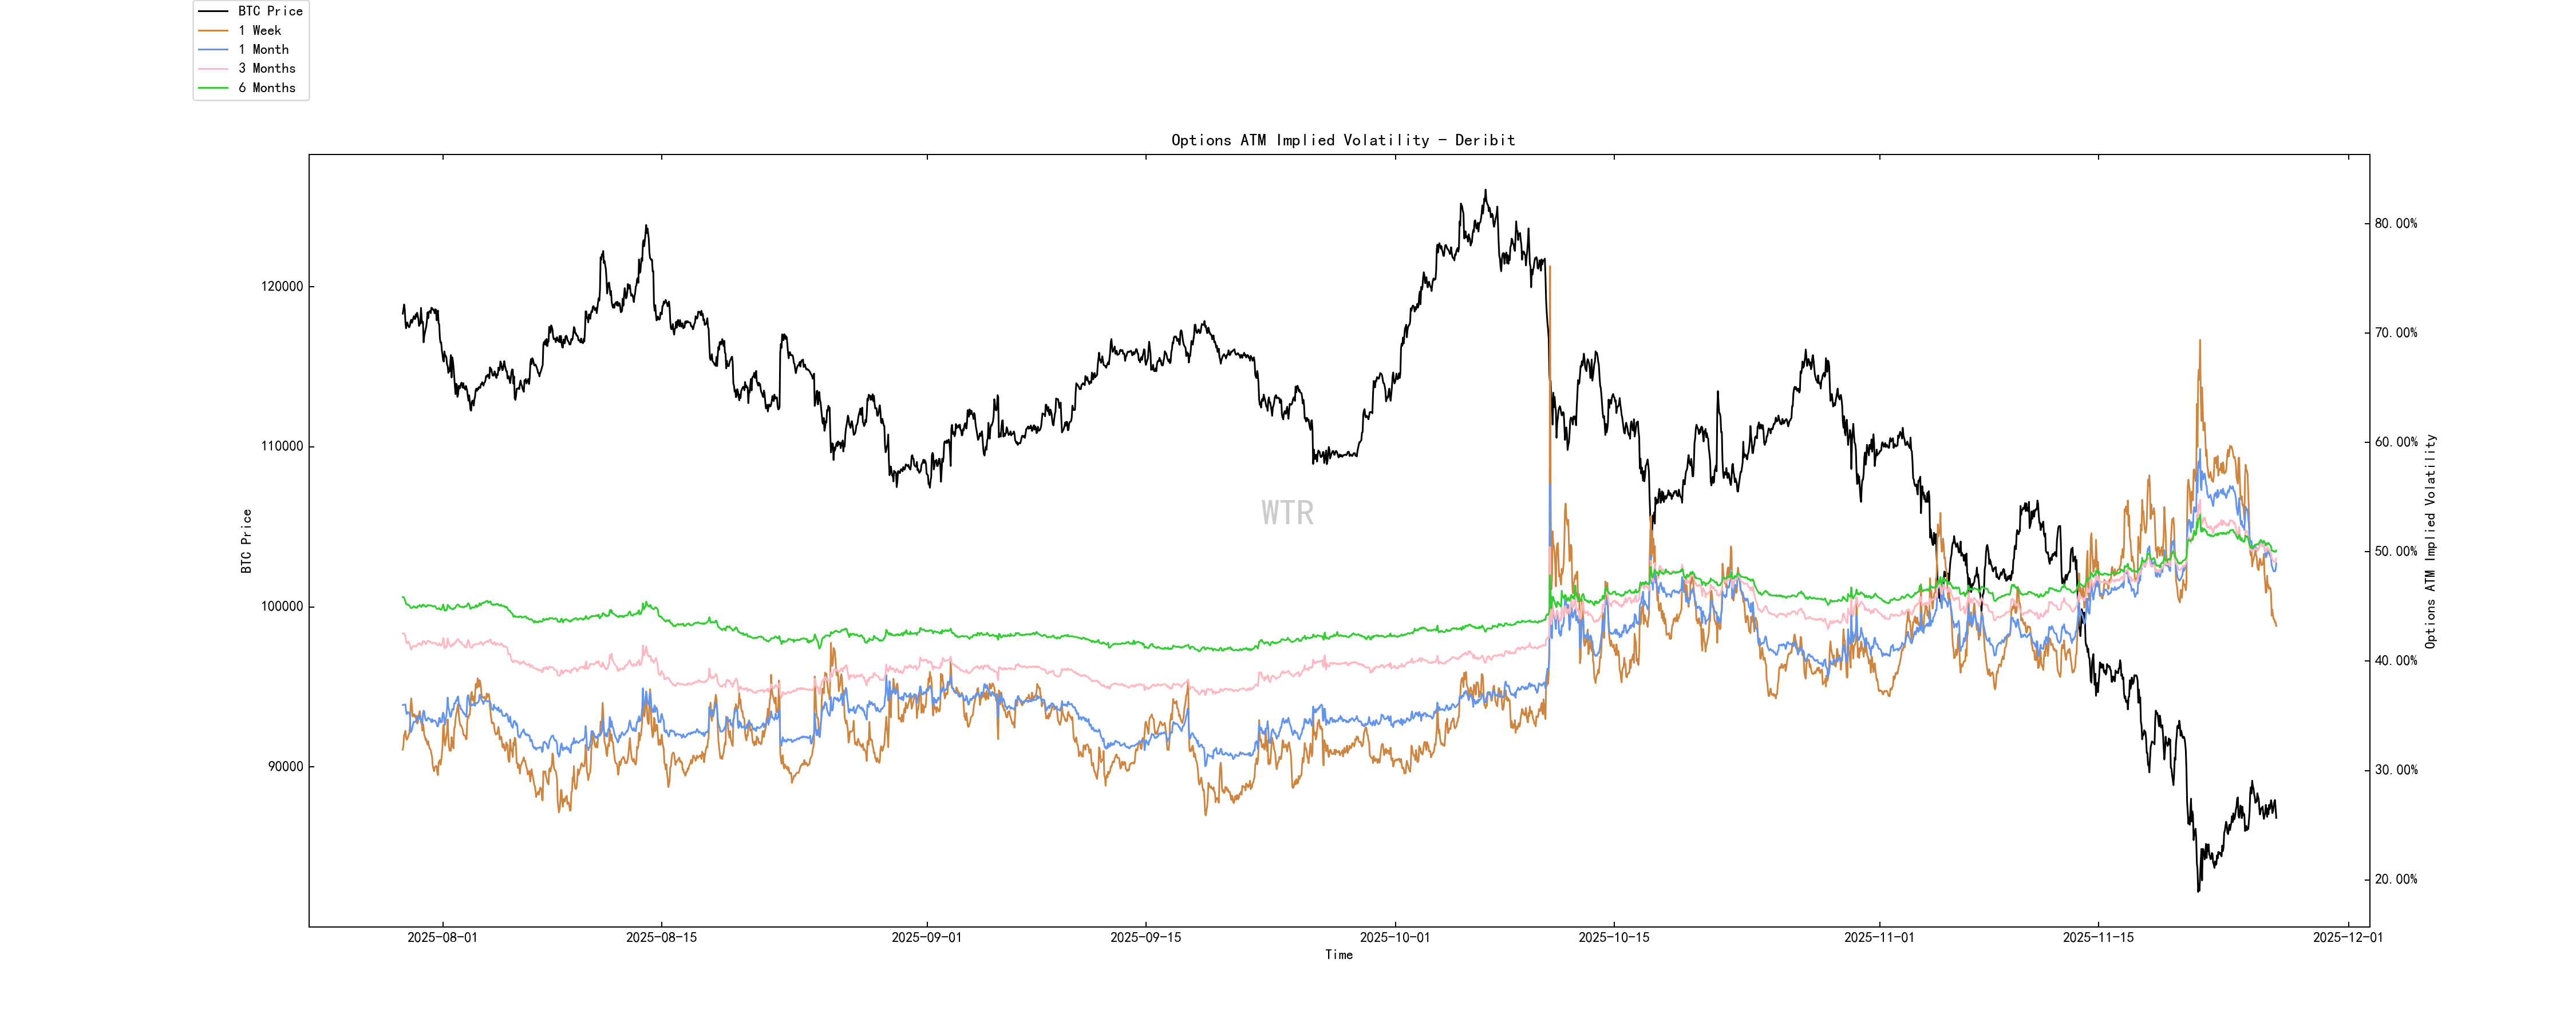
Options implied volatility shows rapid fluctuations.
Sentiment state rating: Panic
(Below is the profit and loss transfer volume)
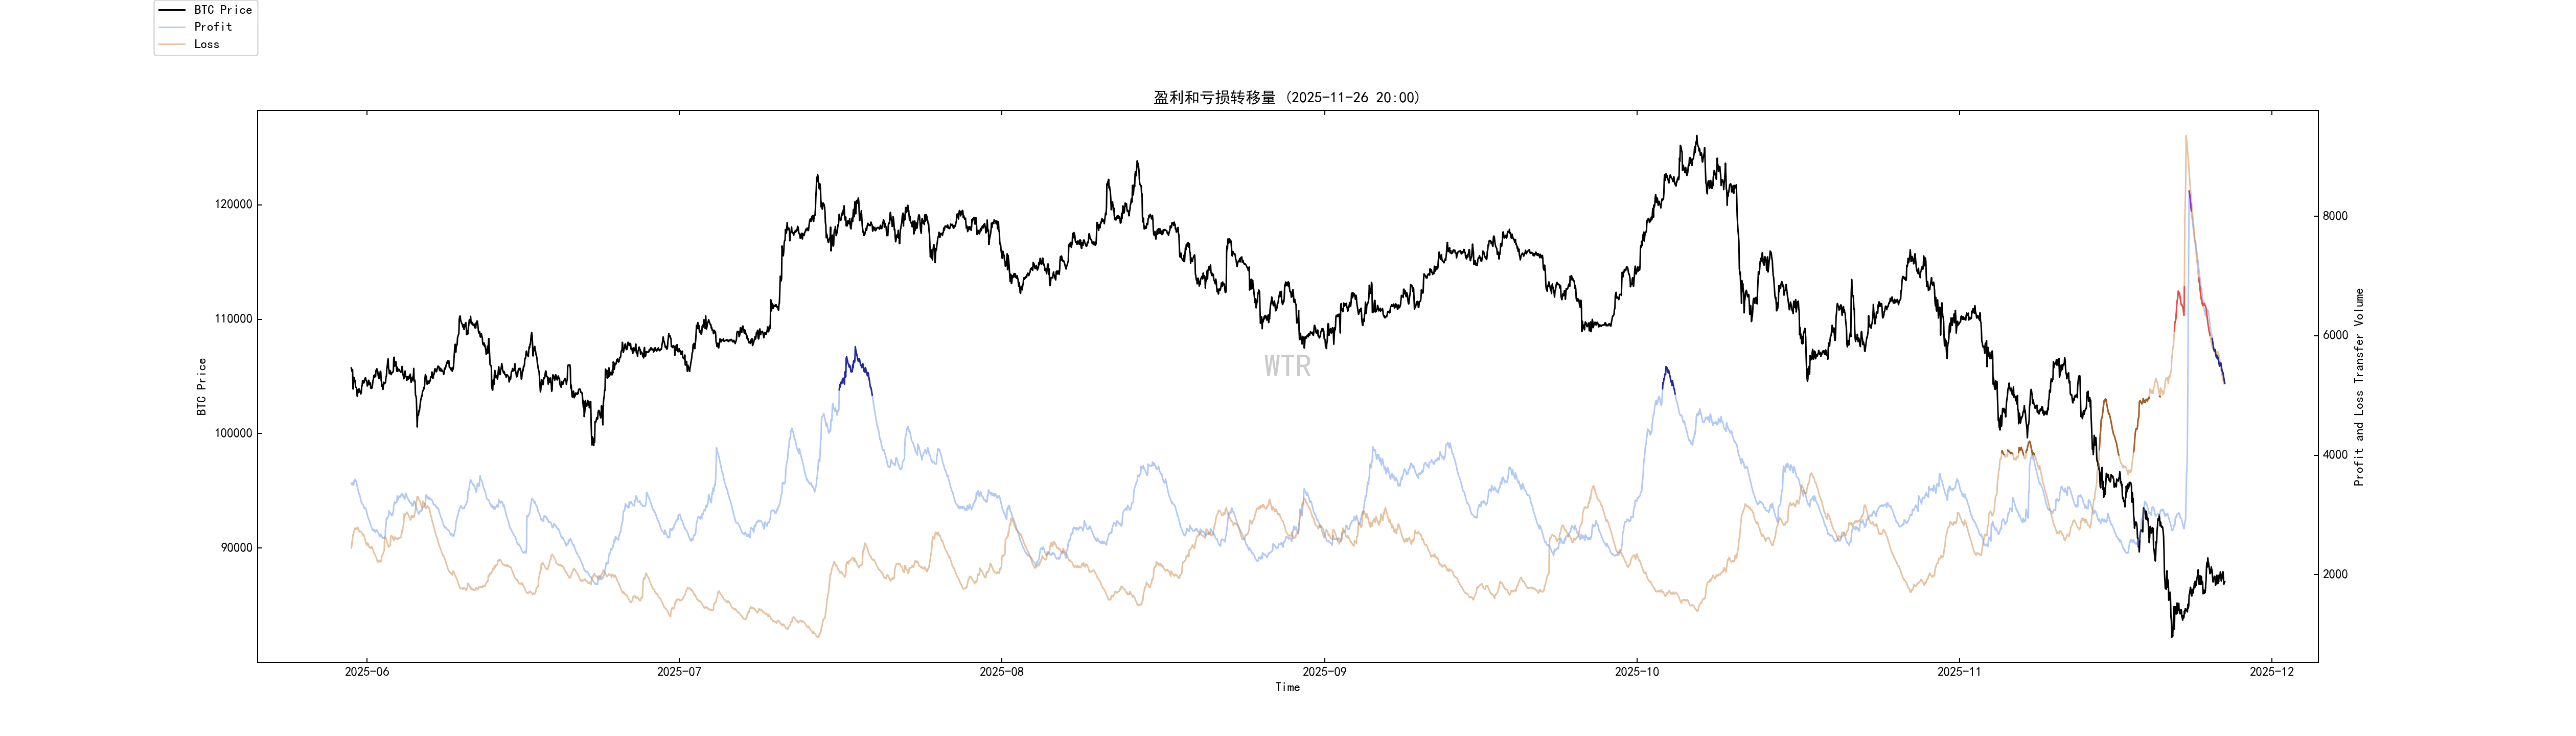
Last week's panic in the market, although influenced by Coinbase's wallet consolidation, still touched the short-term panic extreme value point.
Current panic sentiment has eased somewhat.
(Below is the number of new and active addresses)
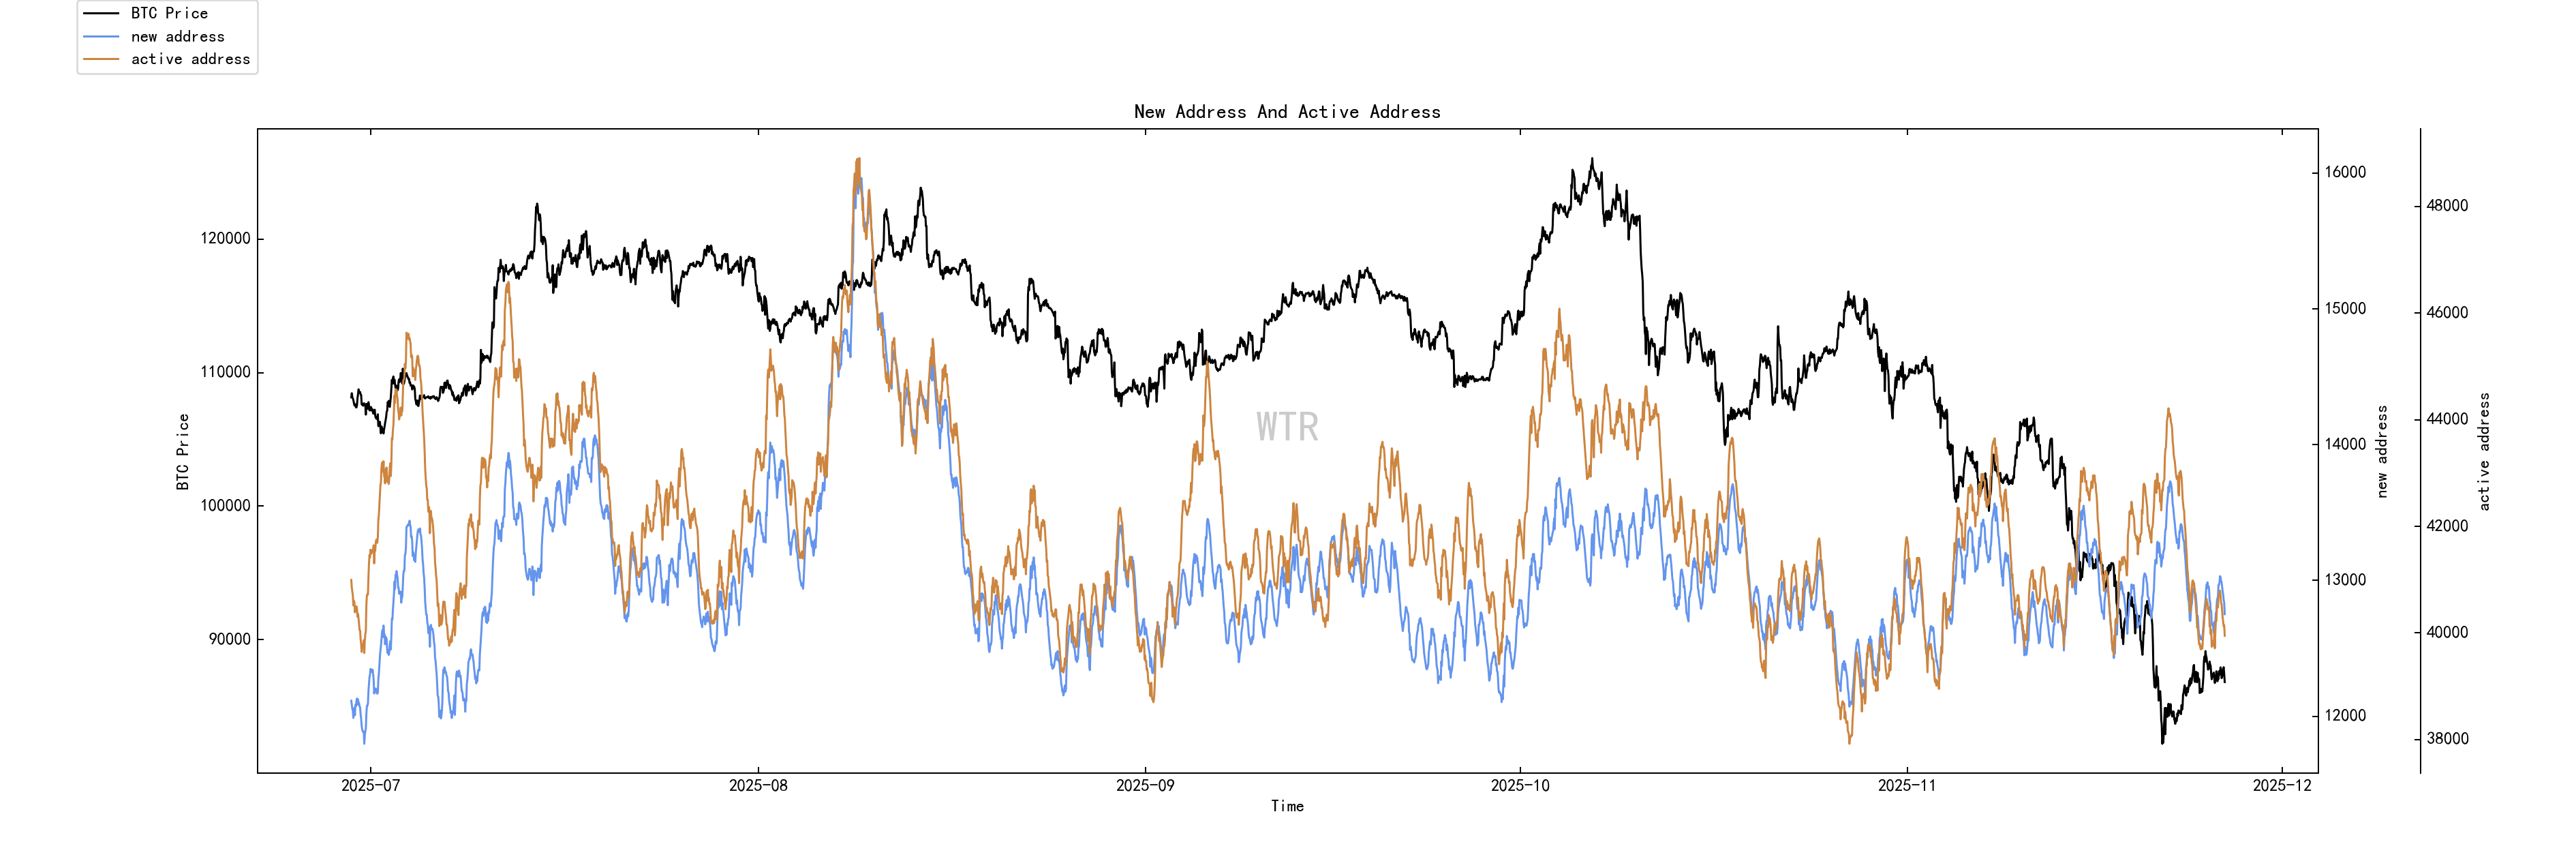
New active addresses are near the low point.
Spot and selling pressure structure rating: Overall net positions of BTC and ETH in exchanges have not changed significantly.
(Below is the net position of Ice Sugar Orange Exchange)
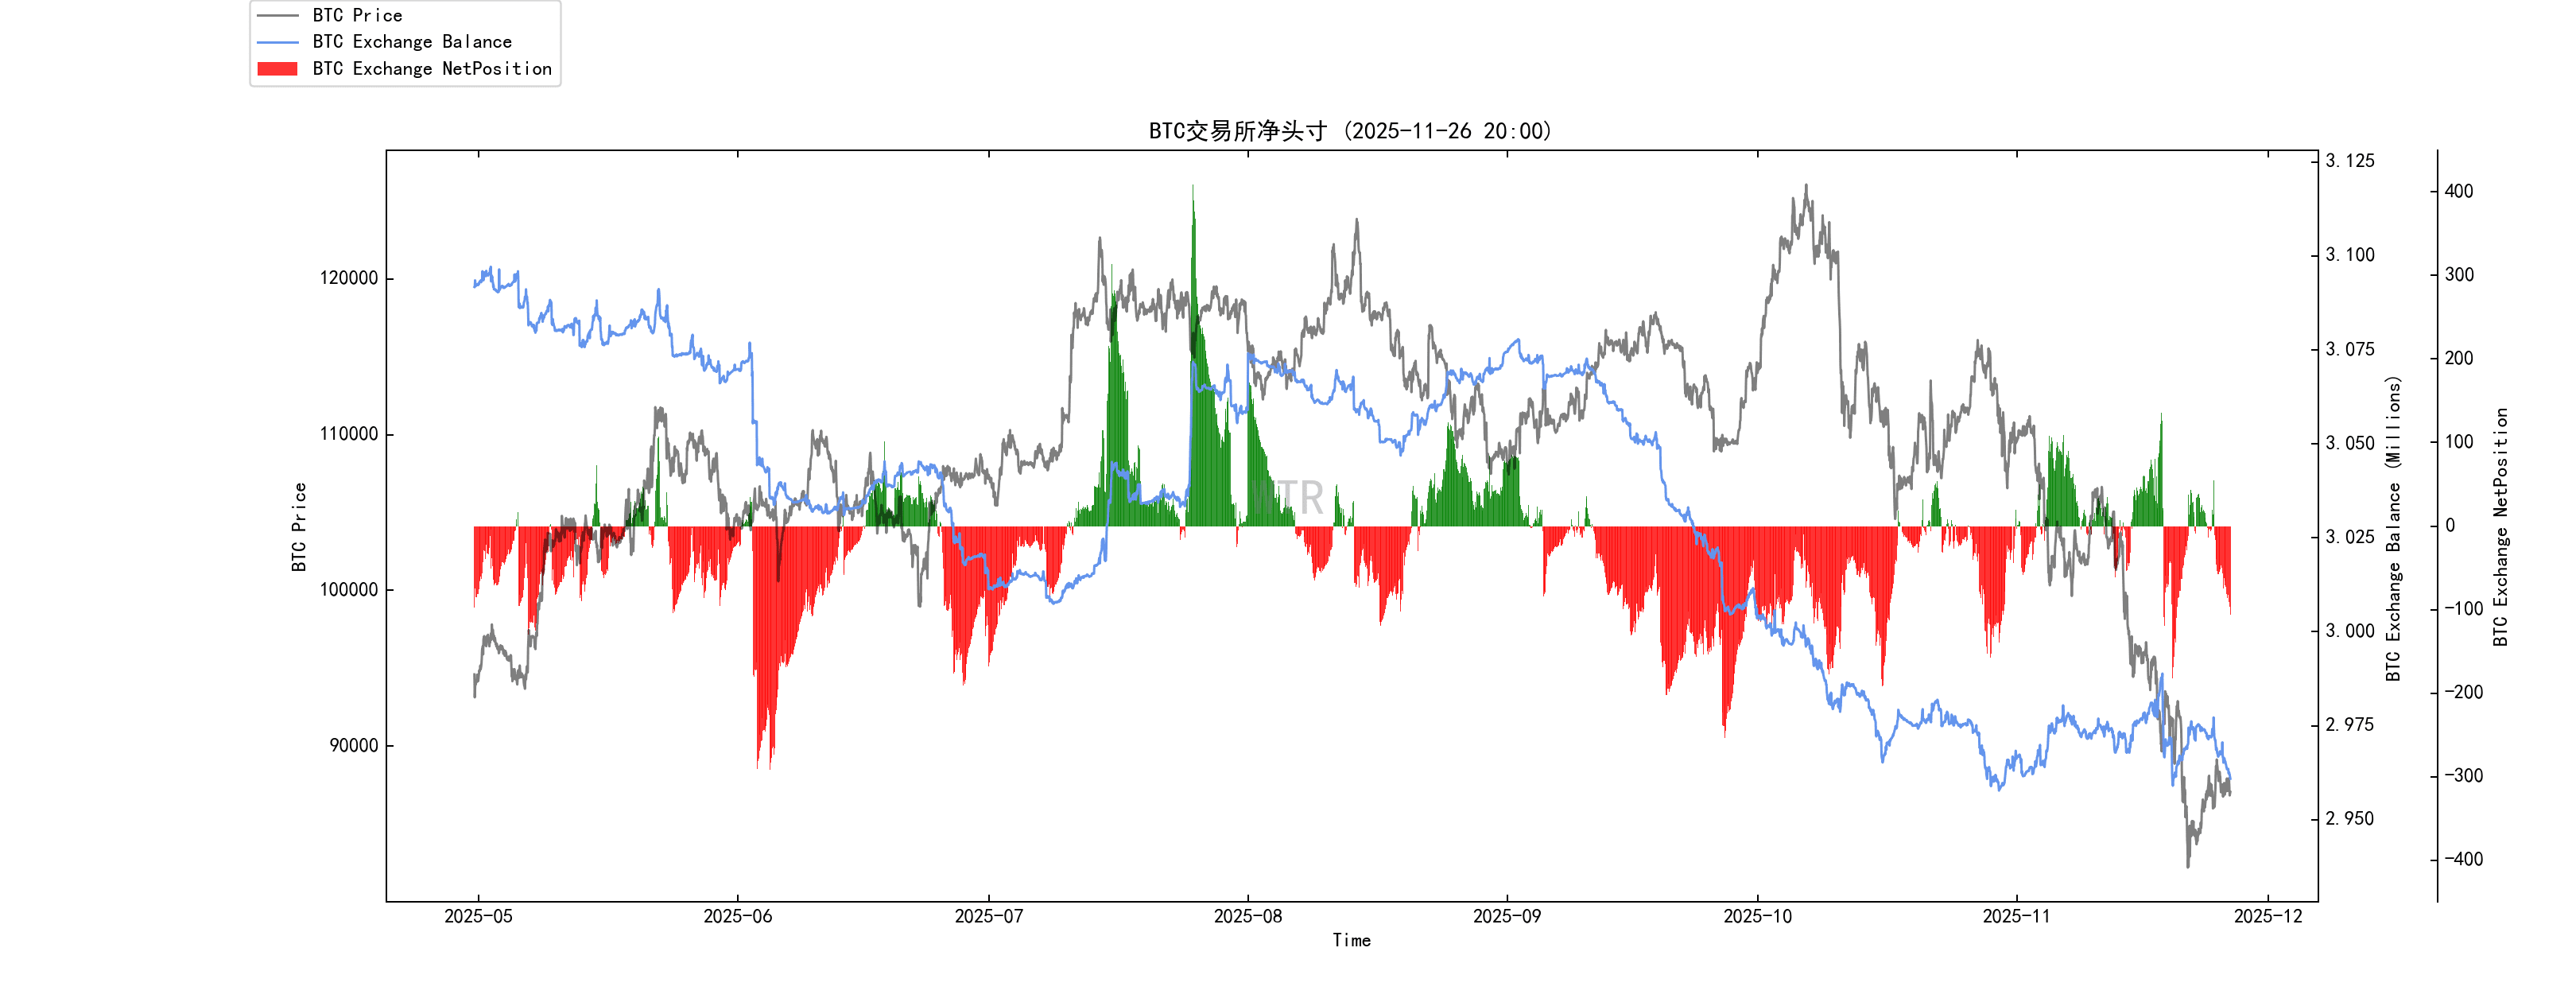
During the decline, some chips chose to flow into exchanges while others chose to withdraw. Overall, there have been no significant changes compared to last week.
(Below is the net position of E-exchange)
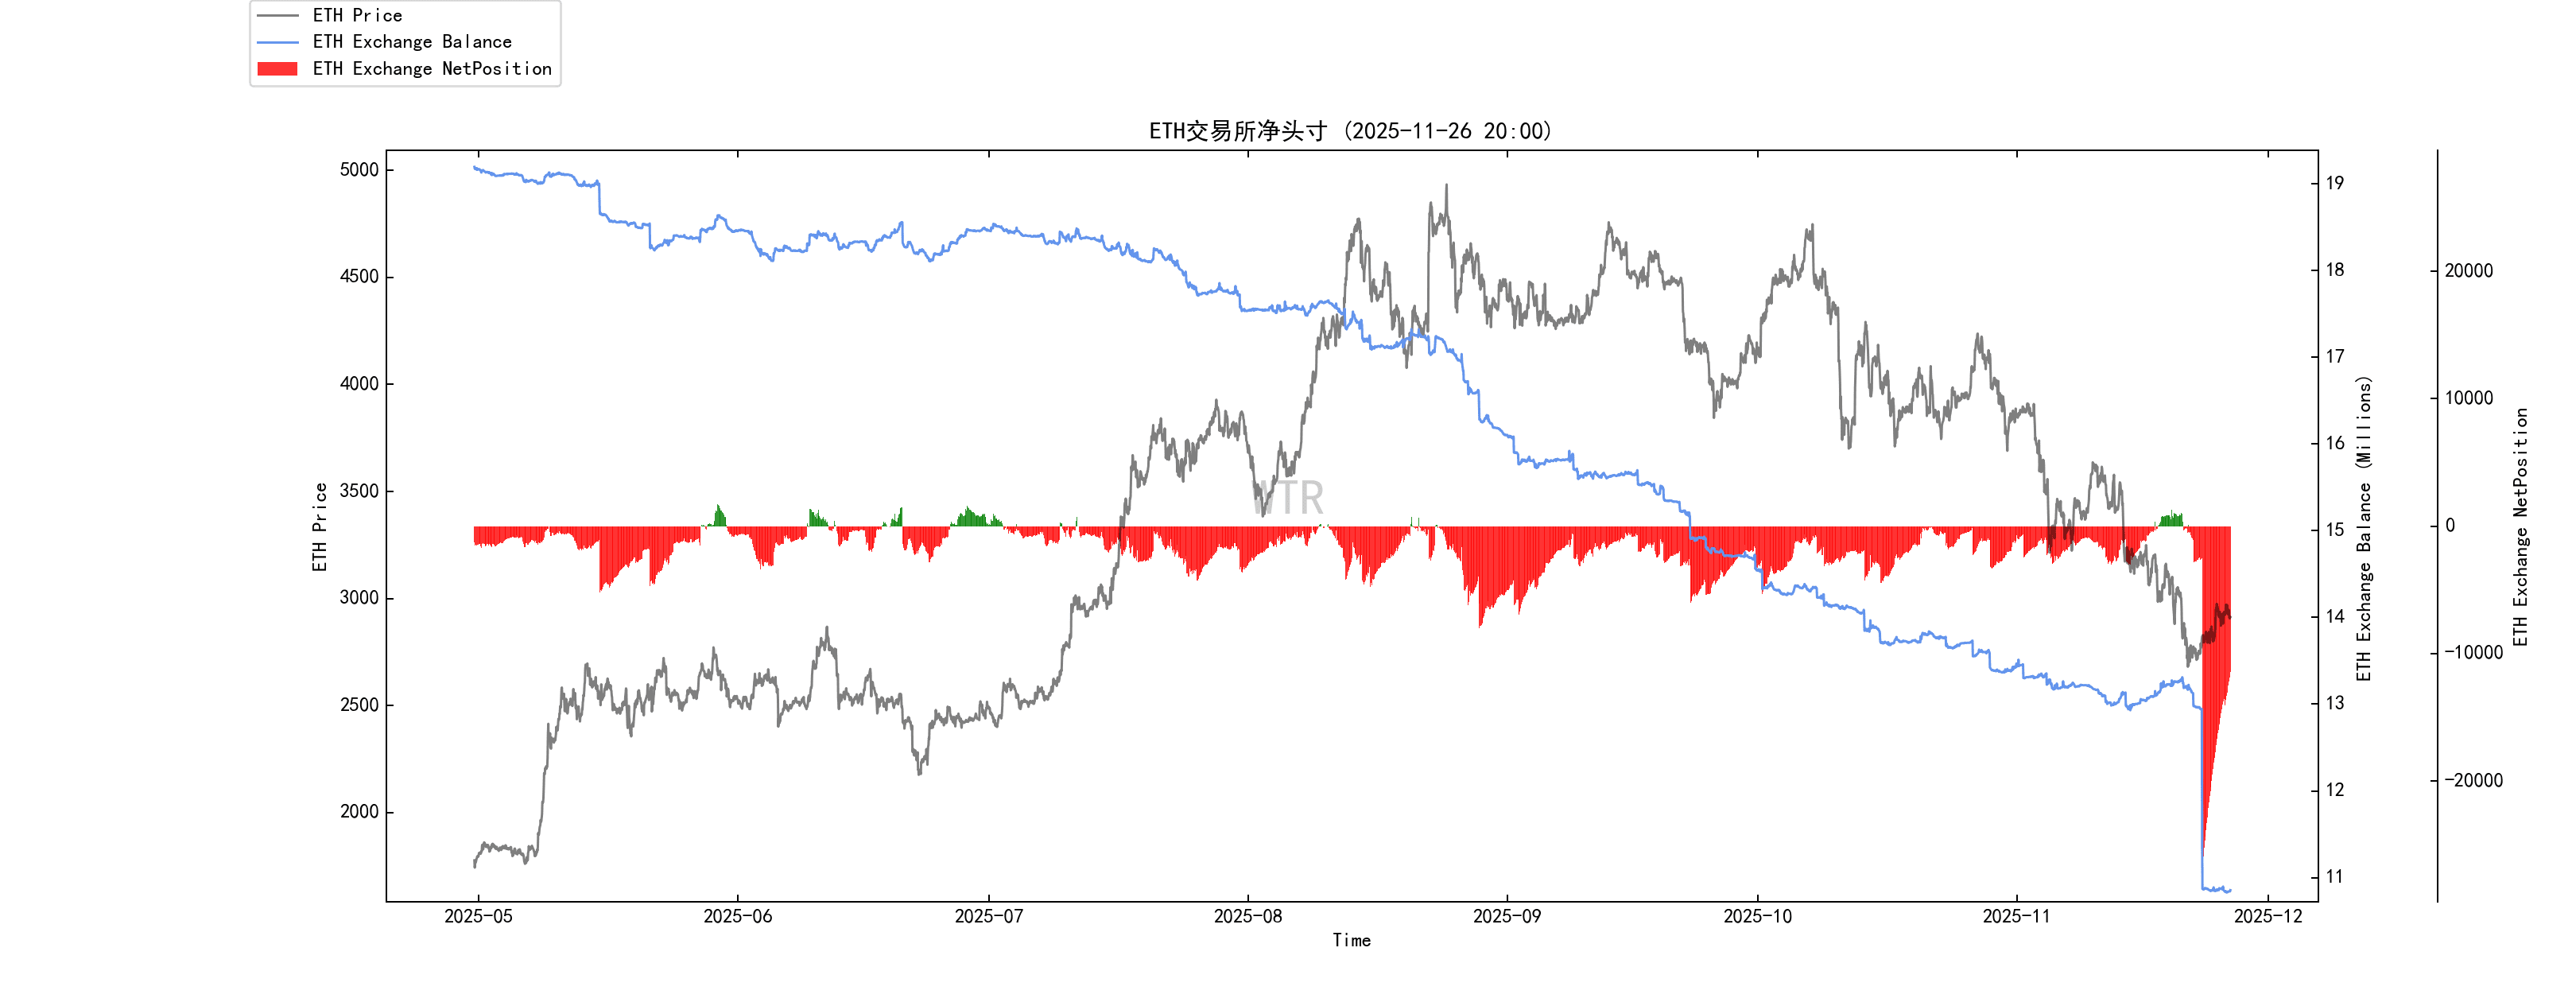
Large outflows of ETH data are influenced by Coinbase; overall, they are consistent with BTC, showing no significant changes.
(Below is the high-weight selling pressure)
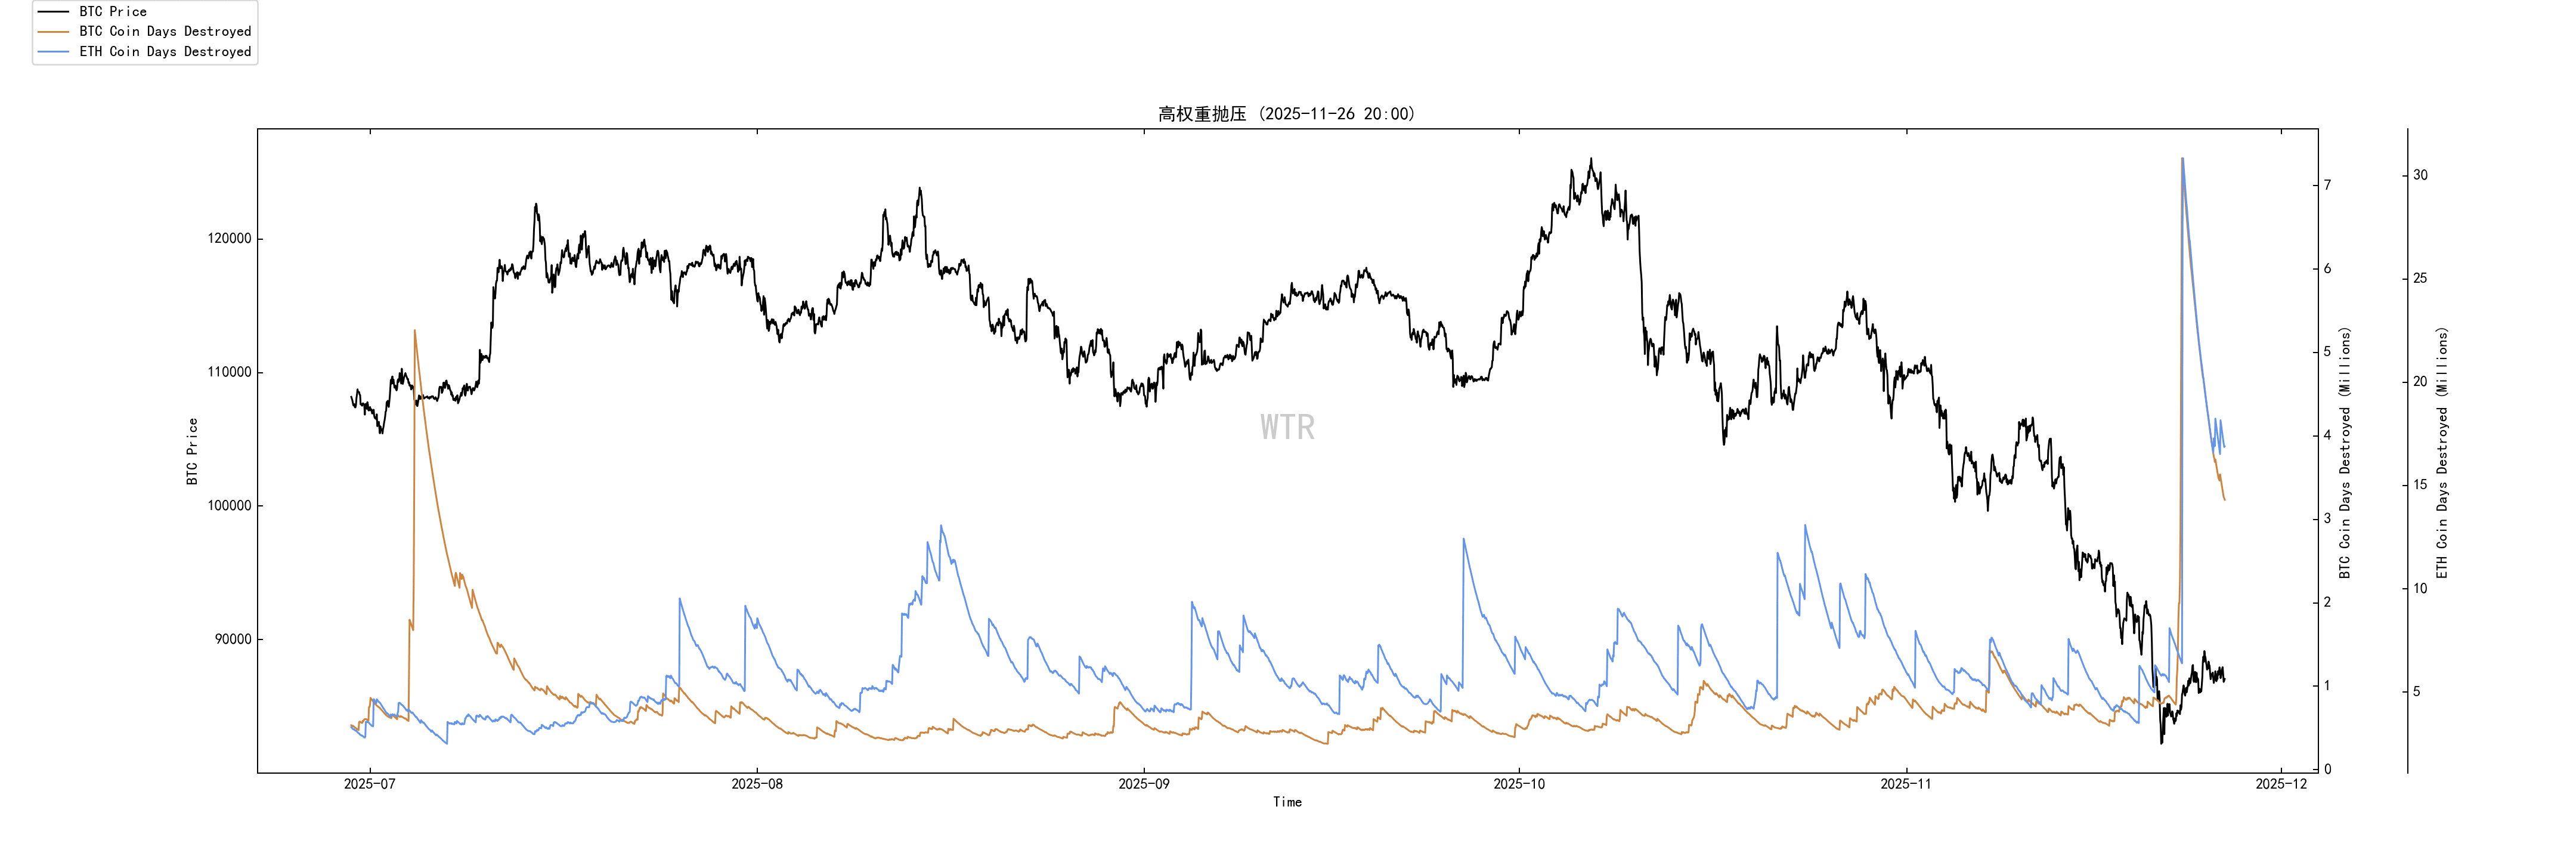
Overall, last week saw frequent high-weight selling pressure in ETH, which has now eased.
Purchasing power rating: Global purchasing power has significantly declined, and stablecoin purchasing power remains unchanged compared to last week.
(Below is the global purchasing power status)
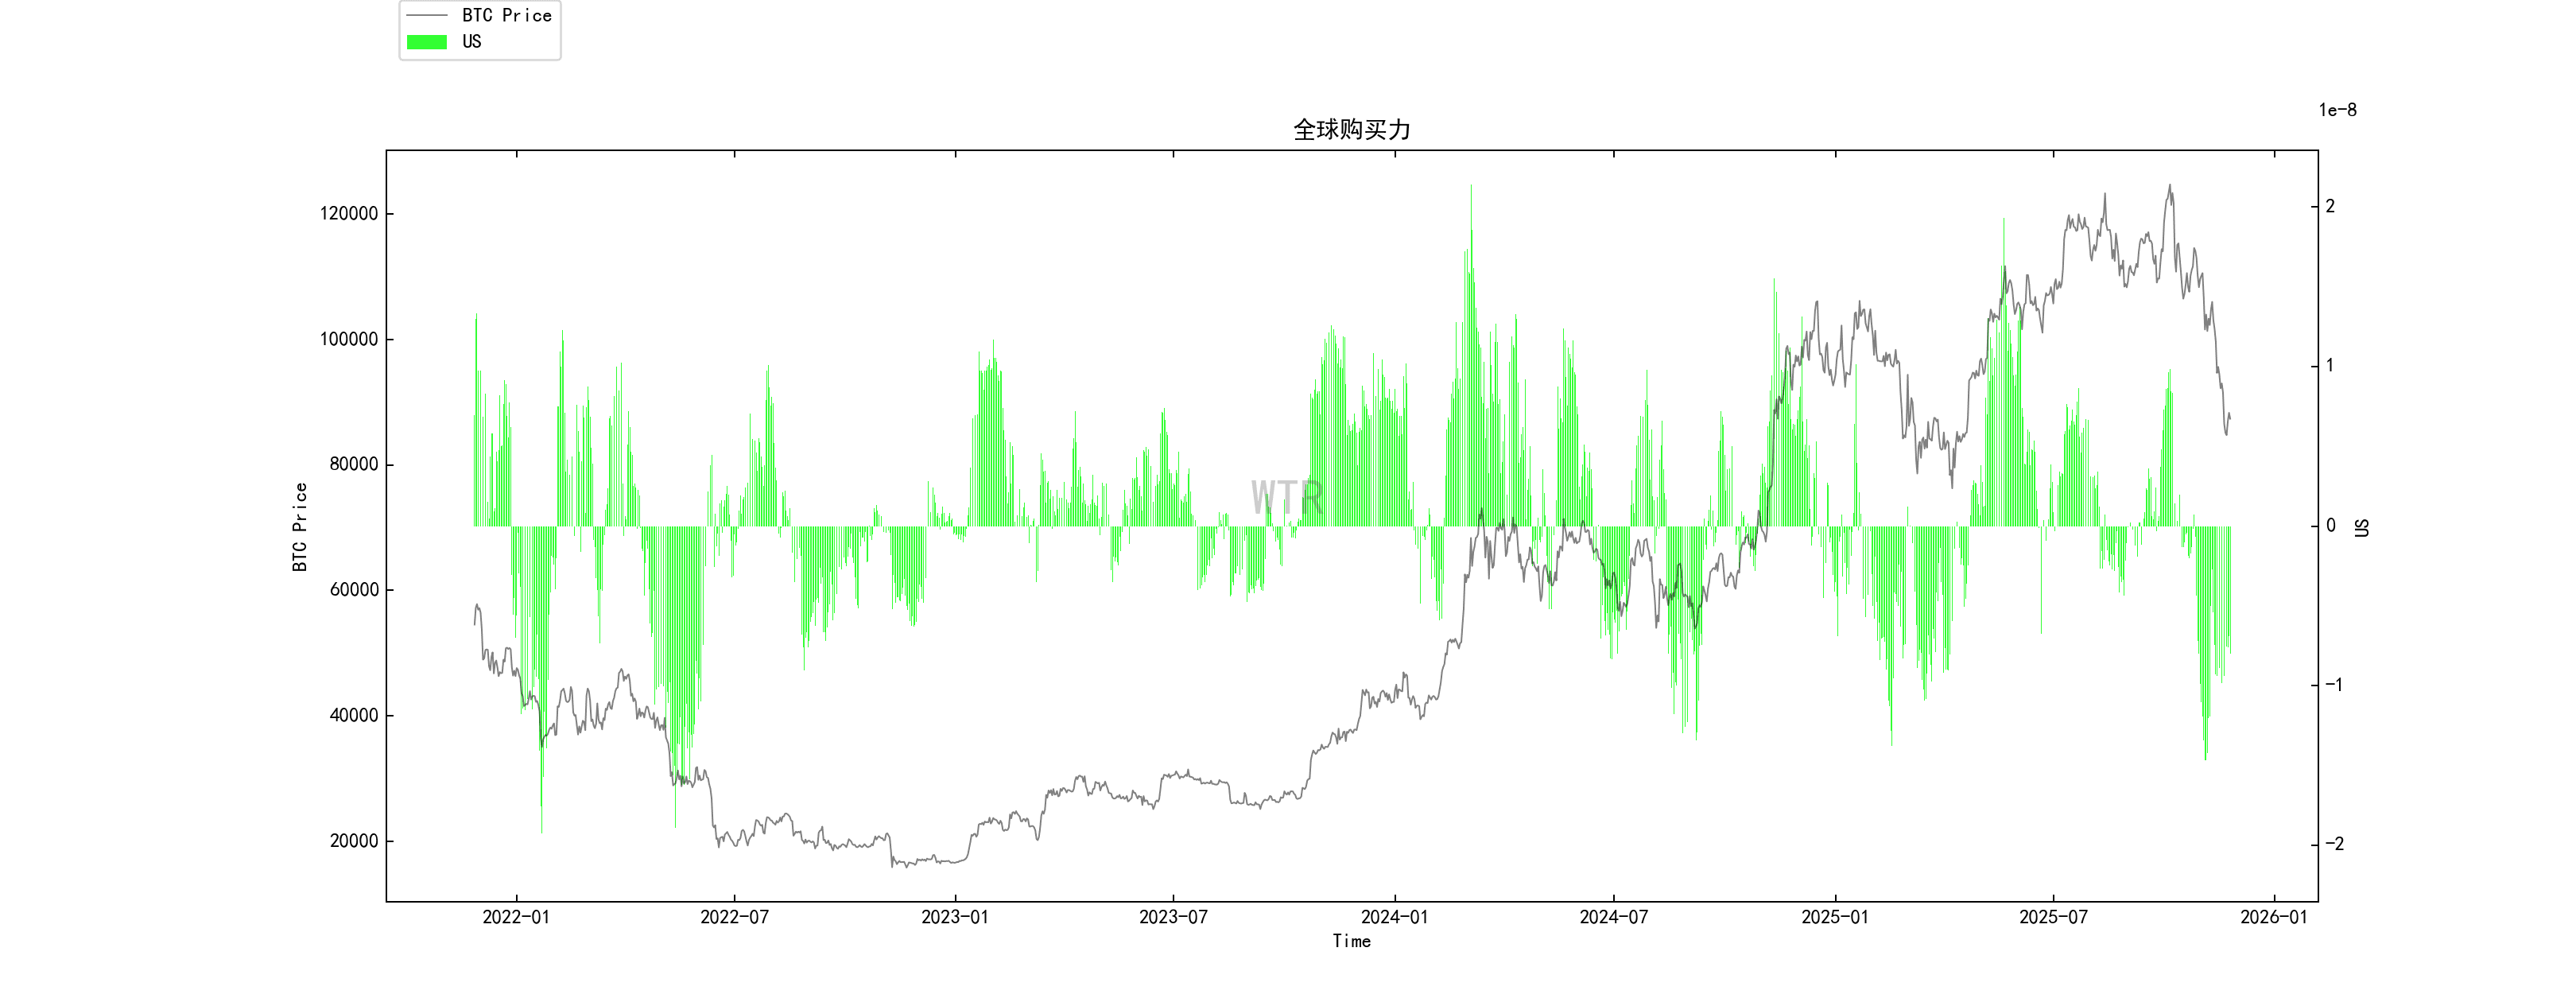
Global purchasing power has significantly declined.
(Below is the net position of USDT exchanges)
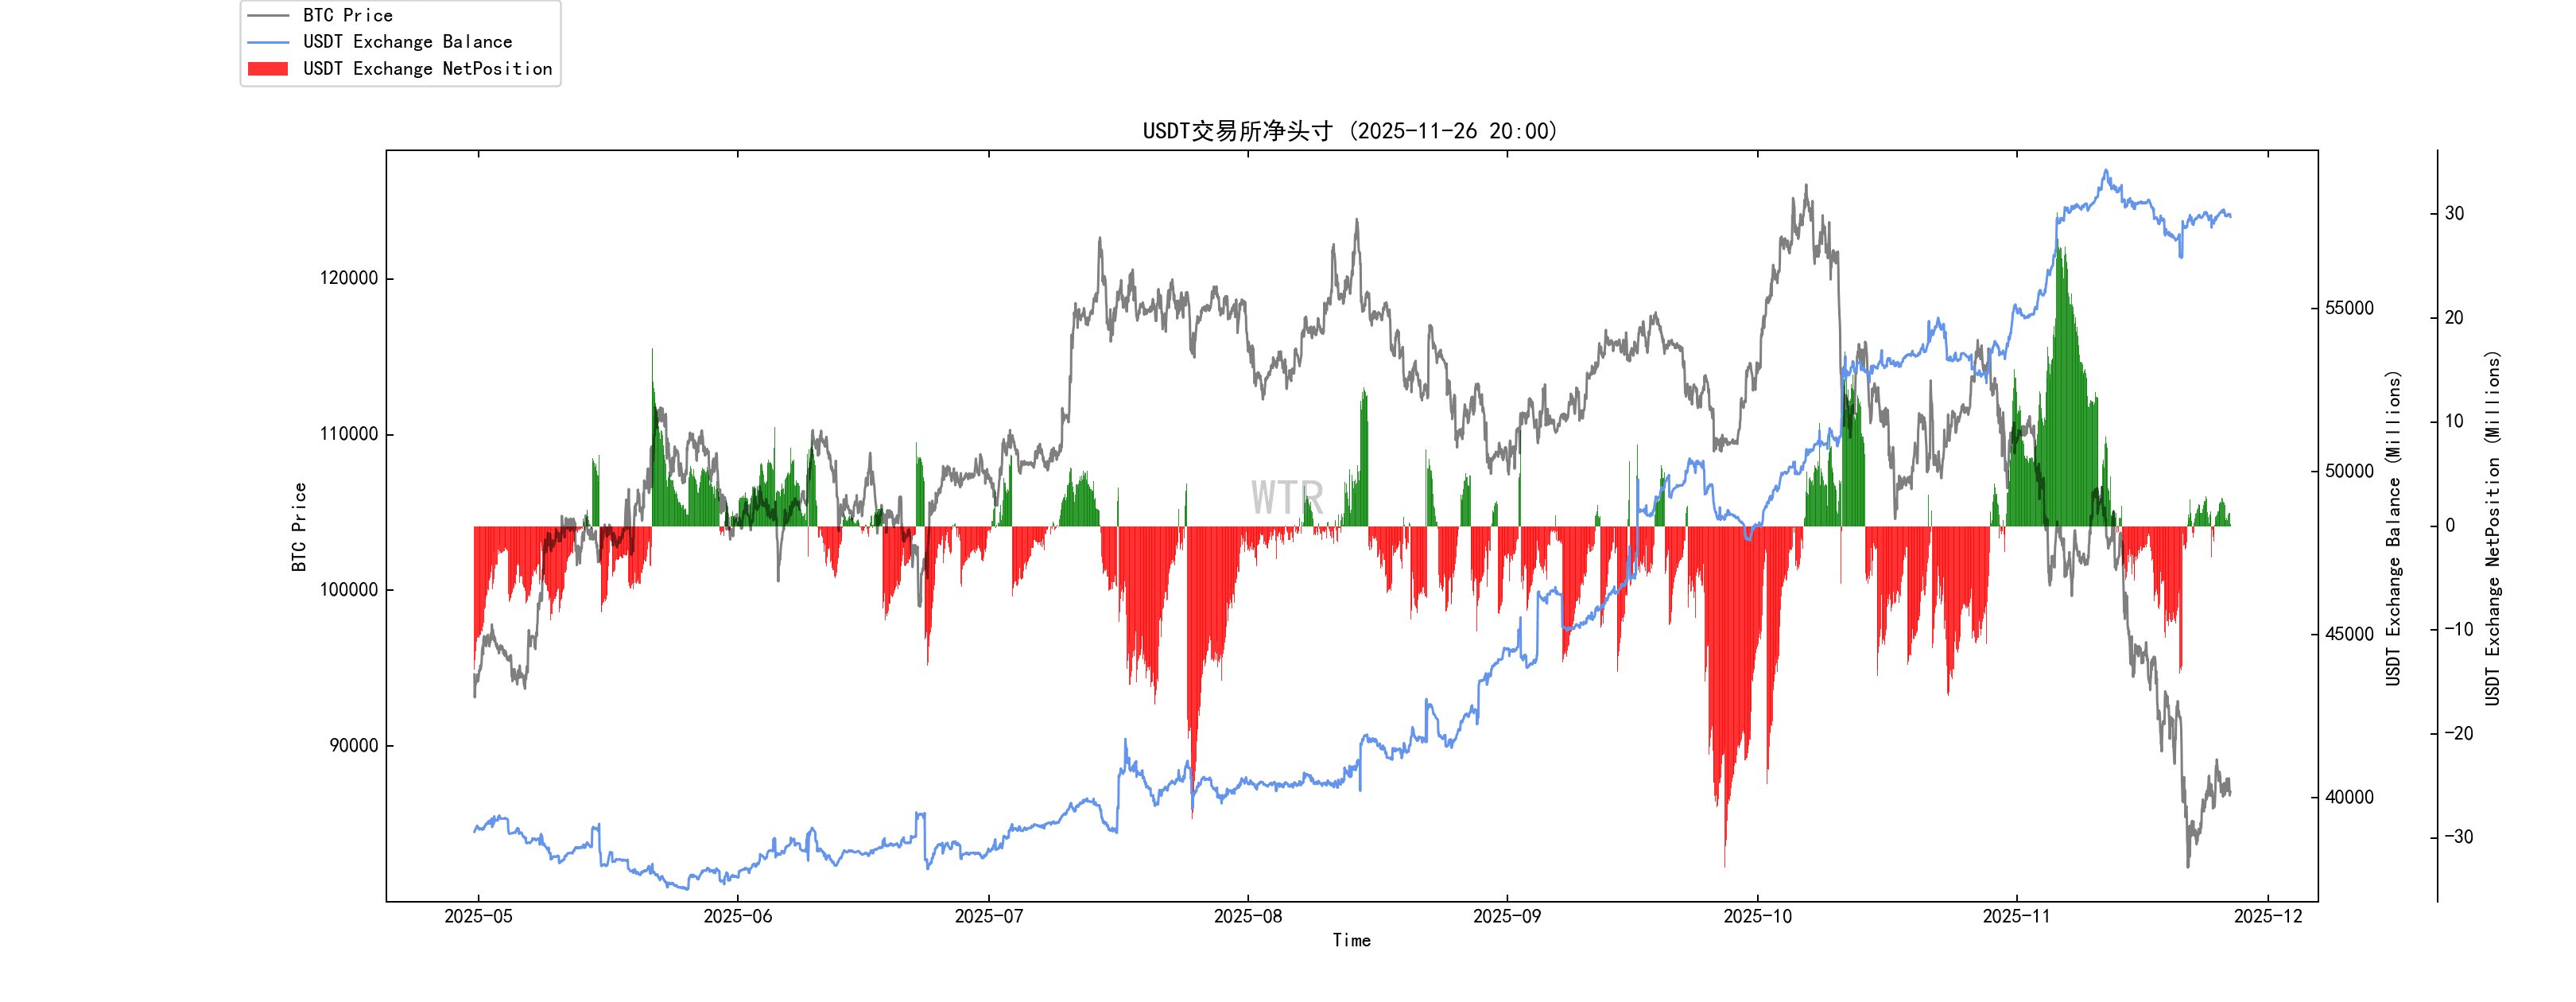
Stablecoin purchasing power remains unchanged compared to last week.
Weekly summary:
Summary of the news aspect:
Overall judgment:
We are at the intersection of 'expected tightening to loosening of macro liquidity + the economic fundamentals beginning to weaken';
In this context, the cryptocurrency market is experiencing a round of deep adjustments, with chips moving from passive/short-term capital to long-term/active capital.
Sentiment is extremely pessimistic, but structural signals (ETF structure, whale accumulation, policy and technical catalysts) point to mid-term repricing opportunities.
The market has shifted from only recognizing BTC/ETH to a broader range of crypto assets gaining institutionalized access.
But the short-term effect may be more on sentiment and rotation rather than fundamentals.
Interest rate channel + bank credit + central bank balance sheet;
These three liquidity channels are shifting from contraction to neutral and slightly easing.
It is a typical environment prototype of warming risk preference.
Capital structure shifted from retail + non-compliant exchanges;
→ Compliant financial institutions + long-position capital + a new generation of educated investors;
Volatility may not disappear, but the risk distribution pattern will change:
Black swans come more from macro and institutional levels rather than a specific exchange blowing up;
Single cryptocurrency's volatility will still exist, but the overall market value will continue to be sensitive to macro policies.
The most probable scenario for the future:
Mild easing + economic soft landing (the ideal version currently being priced by the market)
If the rate cut path is started or confirmed in December, inflation will slowly decline but will not lose control again;
Layoffs are increasing, but the economy as a whole is not falling into a clear recession.
Possible structural rhythm:
Overall risk assets:
US stocks continue to rise, led by technology/AI;
Gold maintains high levels or even sets new highs in the context of declining real interest rates.
BTC (risk barometer): Gradually recovering from extreme panic, on-chain whale accumulation + net outflows from exchanges has strengthened the medium-term logic of supply tightening.
Overall:
The Federal Reserve is shifting from anti-inflation to rebalancing between inflation and employment.
In addition to the loosening of bank regulations and marginal easing of the balance sheet,
Restarting a round of shadowy liquidity repair;
Below this, although the sentiment in the cryptocurrency market is extremely pessimistic, and ETFs are experiencing short-term outflows, chips are concentrating from weak hands to strong hands.
In addition to ETH upgrades, SOL ETF continues to see net inflows, RWA and educational institutional dividends,
Mid-term looks more like a preparation stage for a new round of structural pricing rather than a terminal stage.
On-chain long-term insights:
Non-liquid long-term whales have shifted from net buying at high positions to orderly reductions after macro deterioration; old chips are being distributed rather than accumulated.
On-chain spot selling pressure is moderately high, short-term speculators are overall deeply trapped, with thick unwrapping positions above and tentative buying below, but far from a state of despair where everyone is afraid to buy.
As a representative of compliant funds, ETFs have experienced a round of large-scale outflows; currently, they are just stopping accelerated selling, and it's not about inflows; this is the least optimistic link in the whole structure.
The overall proportion of long-term holders has declined from high levels, but still maintains above ~45%, indicating that long-term belief has not collapsed, more so reflecting rational cashing out in the mid-late cycle.
At the macro level, it is transitioning from tightening to loosening, with positive liquidity expectations, but economic shadows press down, and risk assets are overall in a phase of revaluation; cryptocurrency cannot be isolated.
Market positioning:
Currently, this is a high-level restructuring period of the previous round of market conditions, not a clean starting point for a new cycle; both on-chain and ETF actions prove that the clearing is not yet complete.
What truly deserves attention is not who is calling for bottom fishing, but when whales stop reducing their holdings, and ETFs cease their outflows; that will be the moment the next trend truly shows its face.
On-chain mid-term exploration:
The market continuously releases short-term liquidity loss shocks, and short-term participants are no longer the main body of the impact.
Whale scores have decreased, bottom support has weakened, and the market is more cautious when it slightly improves.
USDC buyers maintain a neutral participation attitude, with scores at a moderate level.
The accumulation in the 82,000 chip area is obvious and may become a new transaction area, still facing the pressure of unwrapping around 91,000-115,000.
The market is hovering in the profit and loss window, in a risk composite zone, with the risk of a stampede.
Pricing below STH-Alpha lower limit of 91,300 is in a consolidation state, with 78,500 potentially being a new lower limit selling area.
New funds are injected into the market, but the pace has slowed, and the participation intensity has weakened.
Market positioning:
Structural reorganization, directional choice
The market is at a critical turning point, with long and short factors intertwined, and the structure faces reorganization.
On-chain short-term observation:
Derivatives rating: Risk coefficient is in a neutral area, with moderate derivative risk.
New active addresses are relatively low.
Market sentiment state rating: Panic.
Net positions of BTC and ETH in exchanges have not changed significantly overall.
Global purchasing power has significantly declined, and stablecoin purchasing power remains unchanged compared to last week.
Market positioning:
Last week's market panic was once again released, touching extreme values on indicators in the short term. The current market's purchasing power is insufficient, compounded by too many trapped chips above $90,000, making any rebound in the short term weak. This week, the market may briefly stop falling, with a high probability of volatility; short-term operations should focus on strengthening band trading.
Risk warning:
All of the above are market discussions and explorations, not directional opinions on investment; please be cautious and prevent market black swan risks.
This report is provided by the 'WTR' Research Institute.
Welcome to follow us!


