
If you thought that $67k was the bottom, the crypto market decided to test everyone's heart this Wednesday night. The macroeconomic scenario and selling pressure keep weighing in, but those who want to trade like pros need to set aside emotions and read what the real data is telling us. Let's pull up the chart and understand the real situation.
📊 No Filter Technical Analysis: What Does the Chart Say?
Looking closely at the screen in the screenshot 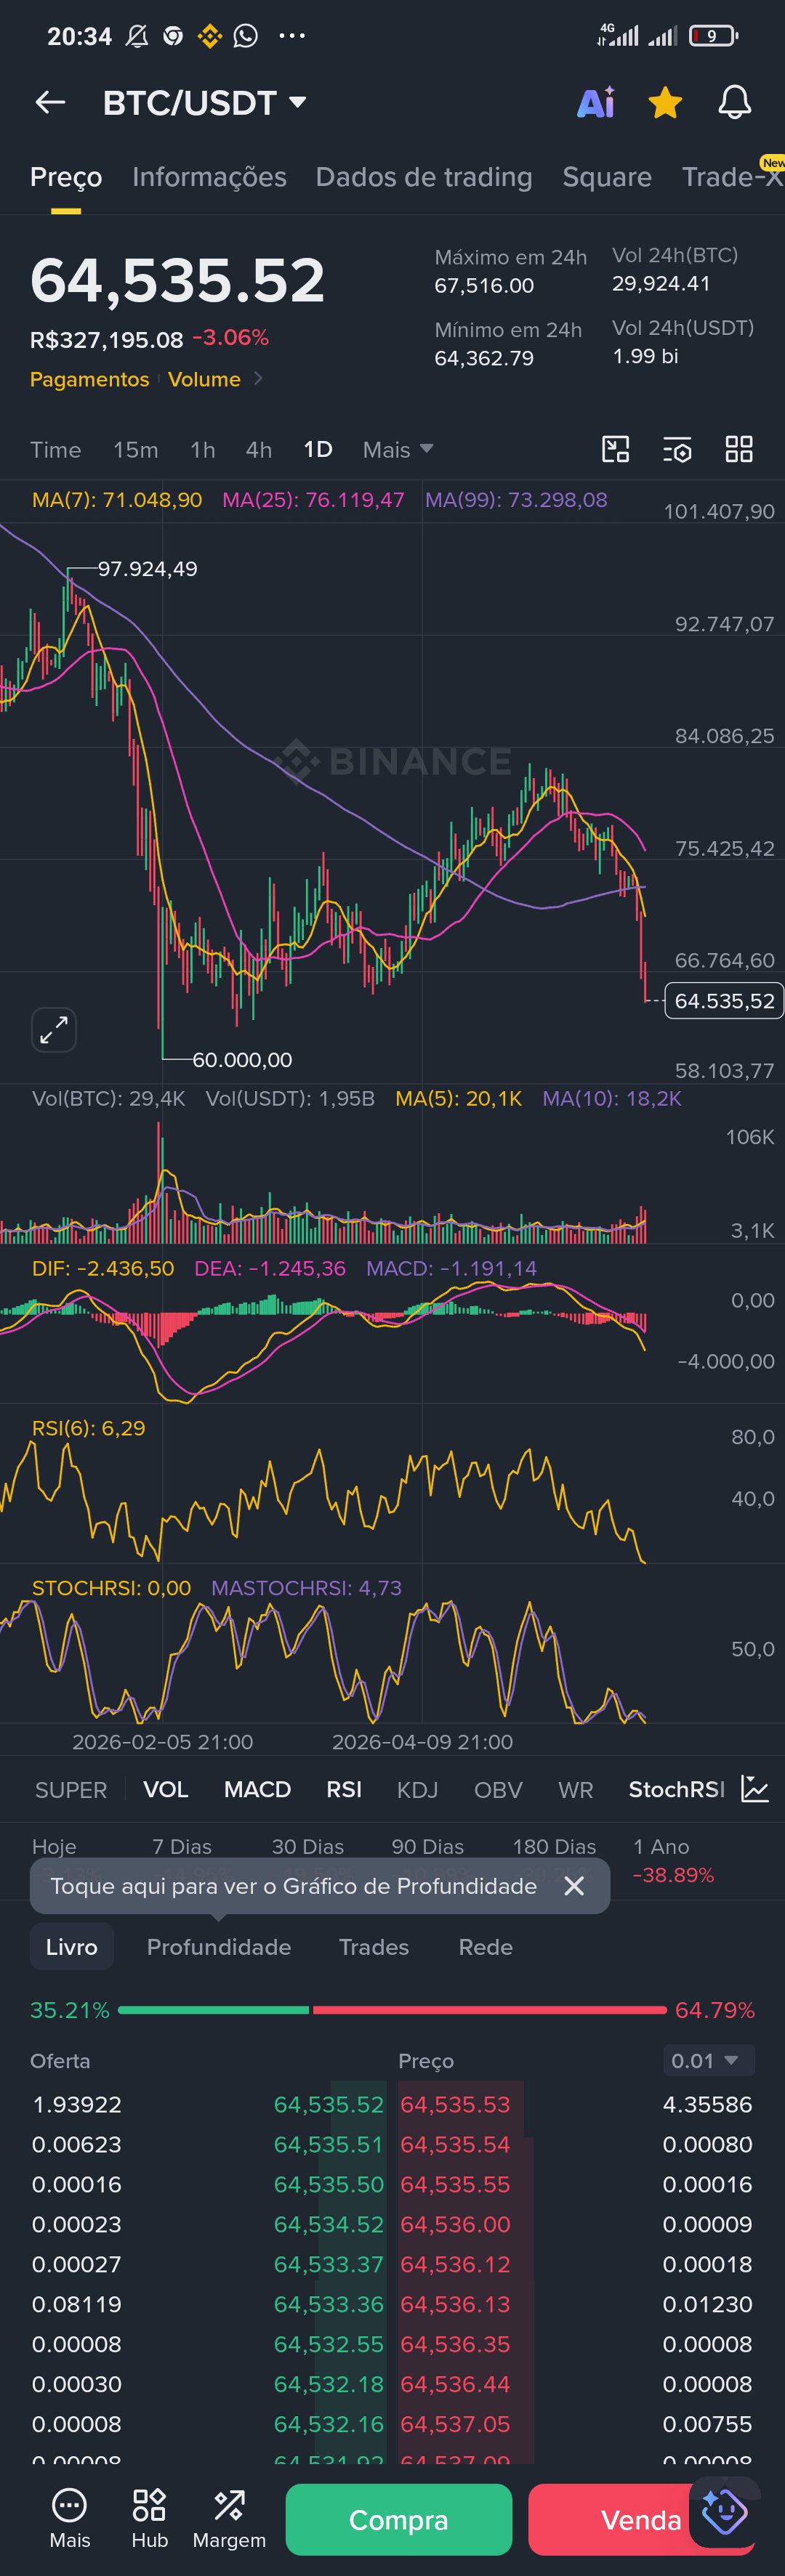 , Bitcoin (BTC) just recorded a drop of 3.06%, trading in the range of $64,535.52. Breaking previous supports has opened the door to test lower levels, but the exhaustion indicators have reached bizarre levels that we haven't seen in a long time:
RSI (6) at Critical Level: The daily Relative Strength Index has plummeted to an impressive 6.29. For those studying chart analysis, anything below 30 is considered oversold, but a single digit indicates extreme and rare exhaustion of the downtrend.
StochRSI Completely Zeroed: The stochastic oscillator hit 0.00. There’s no more mathematical space for the indicator to drop without a technical bounce or strong sideways action to relieve the pressure.
Moving Averages: The 7-period moving average (MA7) is well above, at $71,048.90, showing the extent of the current price distance from the recent average.
🧠 The Order Book and the Psychological Trap
In the order book, retail panic is evident: we have 64.79% selling intent against 35.21% buying. The newbie investor sees the red bar melting, fears the price dropping back to $60,000, and ends up selling at the worst possible technical moment, handing their satoshis on a silver platter.
Selling with an RSI of 6 points and StochRSI at zero is, historically, signing the receipt for loss right at the local bottom. Even though the global scenario is stressed, the chart shows that the selling elastic has stretched too far and is very close to the limit.
My tactical strategy remains firm on the initial plan: shield the psychology, ignore the market's desperate cries, and stick with DCA (Dollar Cost Averaging). Buying in installments during these extreme discount zones is what separates those who survive long-term from those who become liquidity for the whales.
Stay calm, manage your risk, and don’t make decisions based on the heat of the moment.
So, are you all set up in the $64k zone or has fear made you freeze? Drop your thoughts in the comments! 👇💎
#BTC #DCA #BinanceSquare #strategy
