Great — I've seen the two images and I'll give you a technical analysis + short-term scenarios and a practical trading plan (conservative and risky) with entry points, stop-loss, and targets. Write the information based on the images honestly and explain the assumptions.
---
A quick summary of what's in the pictures
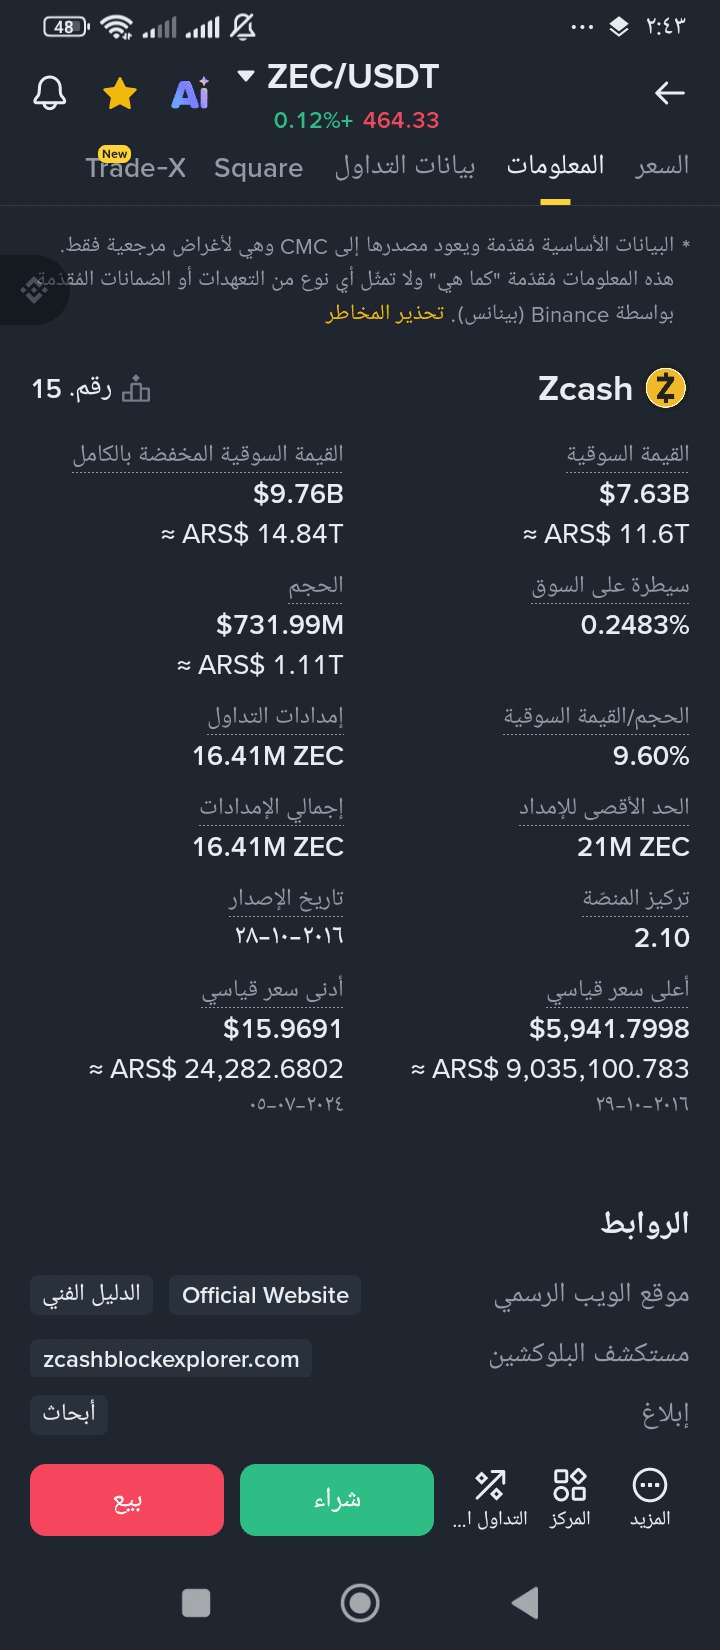
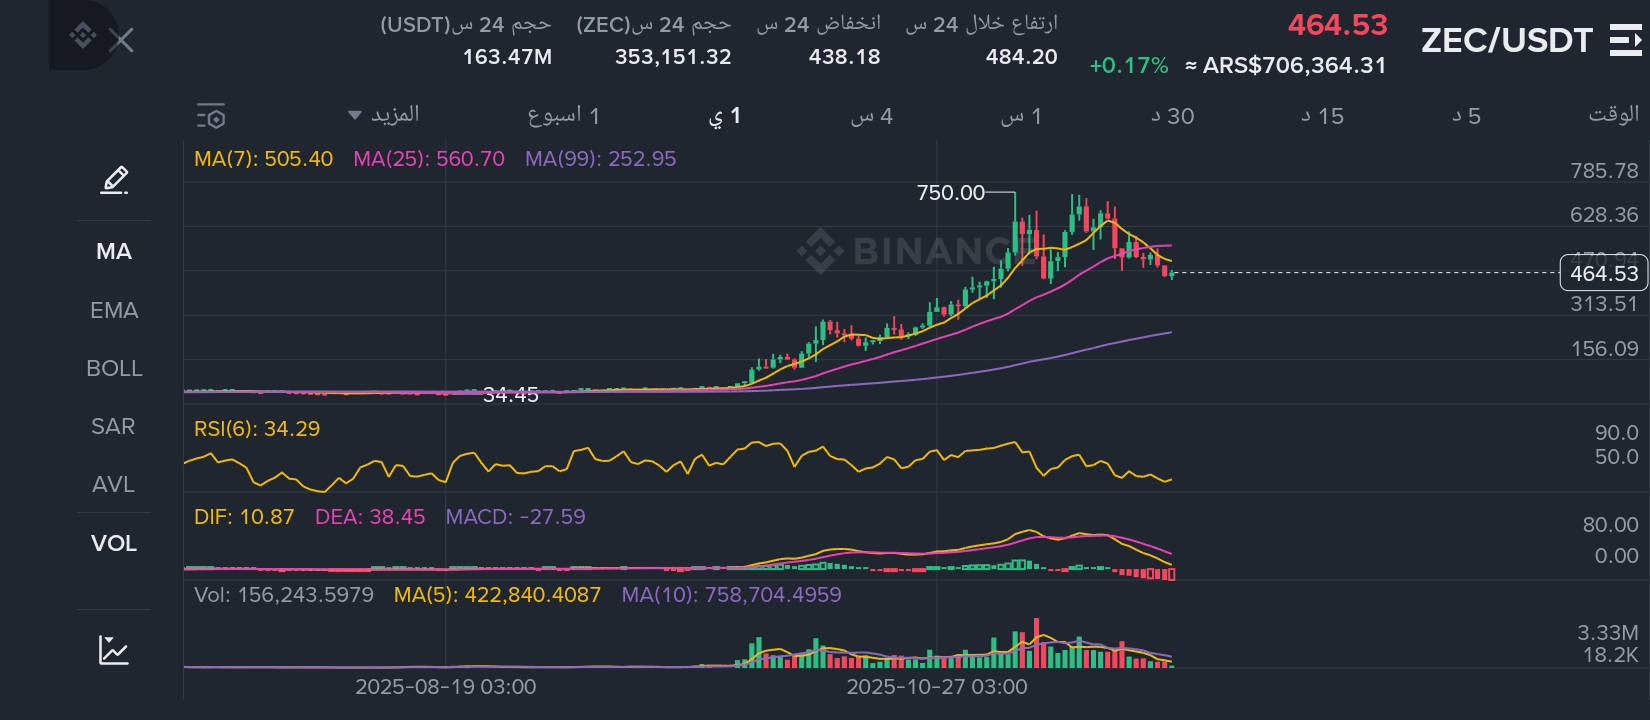
Pair: ZEC/USDT — Current price ~464–465.
Apparent averages: MA(7) ≈ 505.4, MA(25) ≈ 560.7, MA(99) ≈ 252.95.
RSI(6) ≈ 34 (close to the oversold area but not extreme).
MACD: DIF ≈ 10.87, DEA ≈ 38.45 → Negative MACD (DIF under DEA) → Downward momentum.
Trading volume near/after the peak declines (Volume drops) → Loss of upward momentum.
A recent high was around 750 (a short-term historical resistance). The chart shows horizontal levels at approximately 628, 484, 313, and 156 (consider these as reference levels).
--
Technical explanation (simple and straightforward)
1. General trend: After a significant upward surge from lows to ~750, the price corrected downwards. The short-term averages are below the mid-term average (MA7 < MA25), indicating a short-/medium-term downward bias.
2. Momentum: The MACD is negative and the RSI is ~34 → downward momentum, but there is a possibility of a short-term rebound because the RSI is close to the sell zone.
3. Volume: A decrease in trading volume during a decline → The decline may not be supported by very strong selling (it could be a normal correction), but also by a lack of strong buying to support the price.
4. Important levels:
Instantaneous resistance: ~505–560 (MA7 then MA25).
Immediate support: ~400 (psychological zone) then ~313 (clear level on the chart), a break of 313 could open a way to ~156.
Short-term scenarios (days - weeks)
1. Rebound (Positive) Scenario
Condition: Daily breakout/close above MA7 ≈ 505 with increased trading volume.
Expected outcome: Testing MA25 at ~560 then the next target ~630–750. (The upward move needs confirmation of volume and a close above 505–560).
2. The scenario of continued downward movement (the most likely technical scenario now)
Condition: The price must remain below MA7 and MA25, with continued negativity in the MACD and low volume.
Result: A drop to test ~313, and if it breaks strongly with a high volume → probability of a drop to ~156.
3. Lateral cohesion scenario (intermediate case)
The price moves sideways between ~400–560 for a few weeks until a new trend is established (requires a clear break of one of the levels).
--
A practical trading plan (levels, risks)
Important note: I do not recommend high leverage (especially 100x) except for professionals who can afford to lose the entire amount. I will give two examples: a conservative and a risk-taker.
a) Conservative plan (low-medium risk)
Potential entry for partial buying: Support area 320–380 (best on a confirmation candle or clear bounce).
Stop loss: Below 300 (if it breaks 300, close the trade).
Goals (exit reduction):
Target 1: 550 (Partial profit takeover near MA25)
Goal 2: 700–750 (An ambitious goal if momentum returns)
Capital allocation: For example, 1–3% of the portfolio per trade (depending on your tolerance).
b) Risk/speculation plan (high risk)
Breakout Buy: Enter on a daily close above 510-520 with increased volume.
Stop loss: below 480.
Goals: 600 then 750.
Do not use excessive leverage; if you do, do not exceed 3–5x unless you are fully aware of margin management.
c) Short selling strategy
Condition for selling: A strong break below 300 with high trading volume.
Stop loss: A close above 340–360.
Target: 156 or intermediate levels (e.g., 200–250).
---
Risk management (golden rule)
Don't invest all your capital in a single trade. Spread your entry (DCA) or take a small position first and then increase it with confirmation.
Use a specific stop loss and do not deviate from it.
Do not use high leverage if you are not sure and accept a 100% loss on the amount raised.
Set a risk percentage for each trade (e.g., 1–2% of your portfolio).
---
Buy/sell signals to confirm the decision
Buy if:
Daily close above MA7 (~505) with high trading volume, and/or
MACD is making a bullish cross (DIF cuts DEA from bottom to top), and RSI is rising above 50.
Sell/reduce risk if:
The price remains below MA7 and MA25 and is heading towards the 313 level as selling volume increases.
A clear and sustained break below 300.
---
Key short-term factors to monitor
Privacy and regulatory news (Zcash is a privacy coin — any regulatory news that may have a strong impact).
Technical updates/protocol upgrades.
General market volatility (Bitcoin's movement usually affects most assets).
---
A brief summary and final piece of advice
The technical situation is neutral-bearish in the near term until a bullish confirmation emerges (close above ~505–560 with volume).
The strongest support level on the chart is now ~313; breaking that would entail a significant risk.
If you have a desire to enter: use a clear plan, divide your entry, set a strict stop loss, and do not use high leverage unless you are a professional.
 BTCUSDTPerp91,503.4-2.29%
 ZECUSDTPerp462.61+13.38%