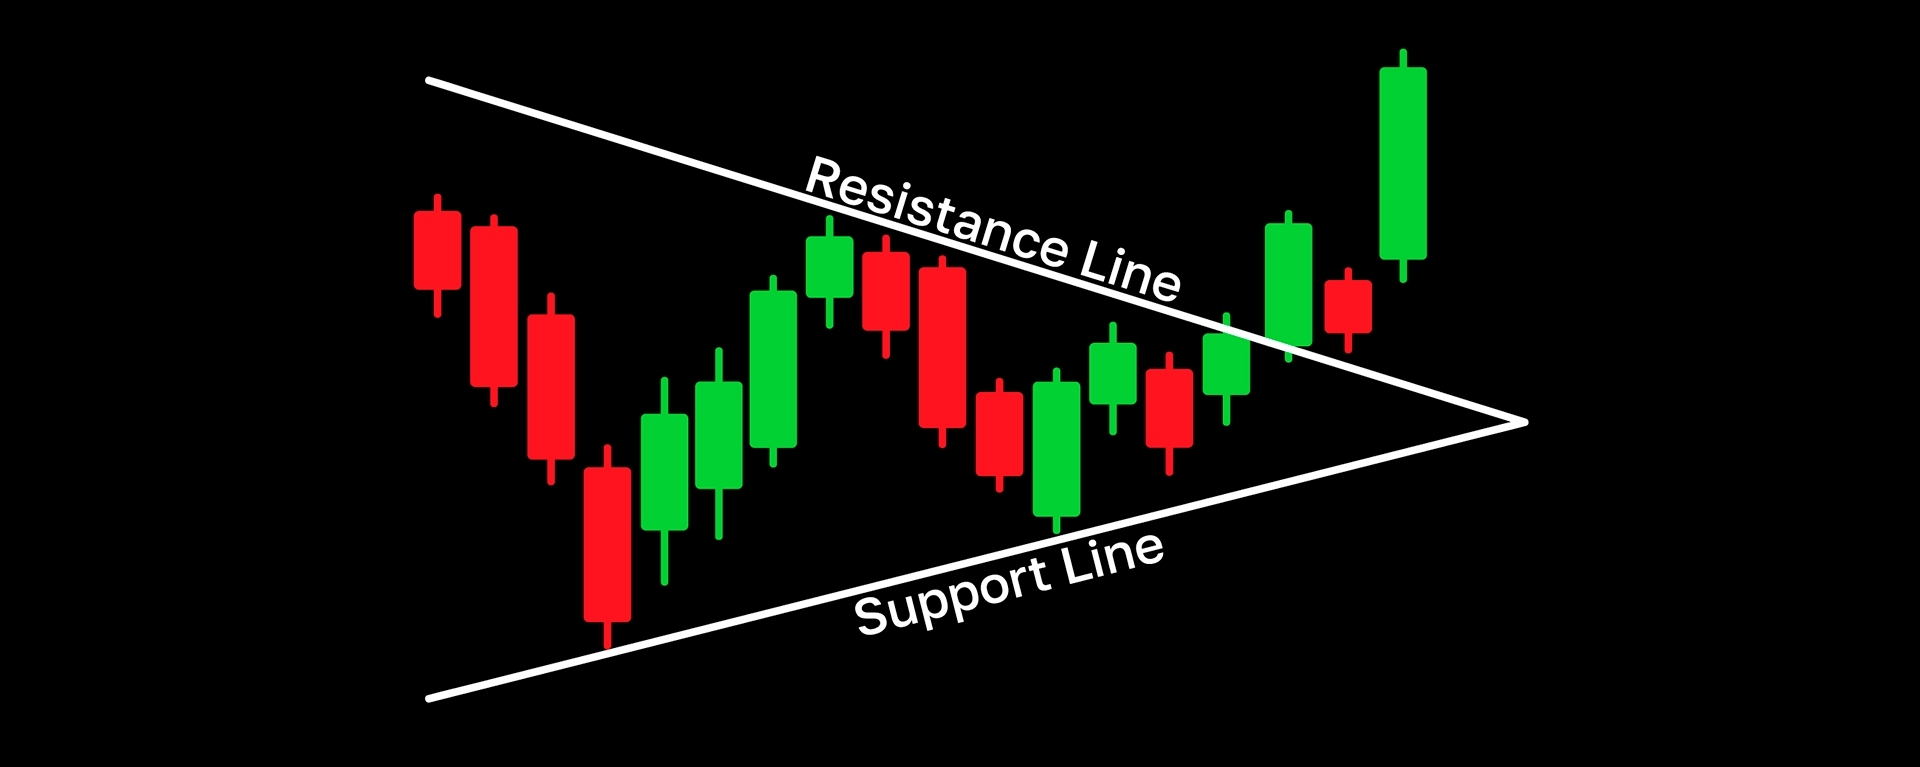
The Bitcoin ($BTC) chart today is forming a symmetrical triangle pattern with extremely tight candlestick ranges. This compression signals a massive breakout is about to happen to sweep liquidity.
📊 Technicals: The price is retesting just below the golden Fibonacci ratio. The short-term frame shows that selling pressure is dwindling, and the Bulls are fighting to hold the fort.
🐋 On-chain:Shark wallets are beginning to set up thick buy walls below to trap retail price shakeouts.
💡 Strategy: Absolutely avoid switching to high leverage right now. Be patient and wait for the candlestick to close, confirming a clear trend break before jumping in! Don’t get caught in a nasty wick sweep.
What price level are you guys waiting for $BTC? Drop your comments below! 👇