Technical Analysis by: [Mr BN Square]
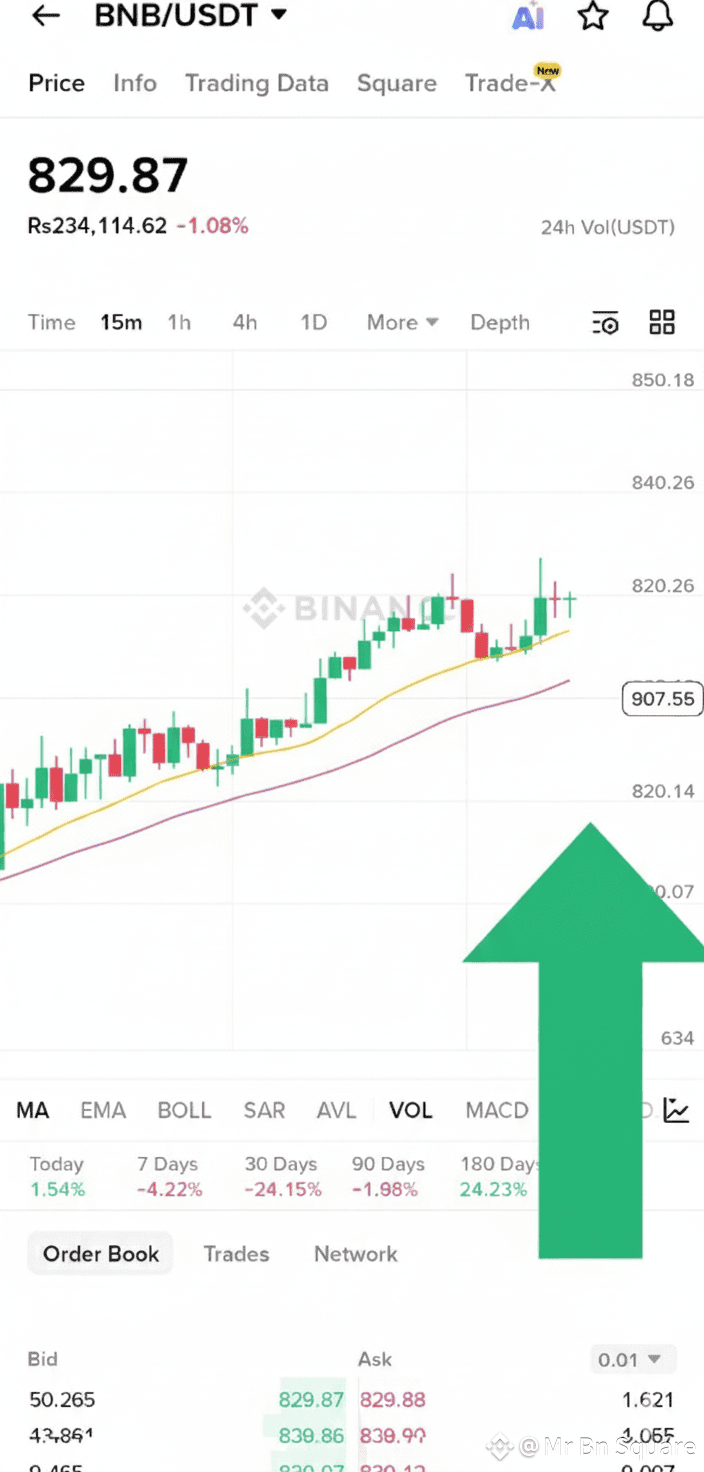
If you've been watching the crypto market closely, the recent performance of $BNB /USDT has surely caught your attention. In the last 24 hours, BNB touched a high of $842.51 (24h High) and a low of $801.70 (24h Low). Currently, it appears stable at $829.87, but the real story is hidden in the technical indicators!
🎯 Where Are Traders Looking Now? (The Technical Picture)
The 15-minute chart in front of us indicates a Critical Junction in the coming days.
* Resistance and Support: A clear Descending Channel is forming on the chart. The price has strongly rebounded from the lower trend line (around $820), which is a sign of robust temporary Support. However, it needs to break the immediate $834.00 Resistance to confirm that the Buyers are in control.
* Moving Averages (MA): The three key Moving Averages (MA(7), MA(25), and MA(99)) are all very close to each other:
* MA(7) = $827.17
* MA(25) = $823.86
* MA(99) = $823.77
When these averages are so close, it signals Volatile Consolidation in the market. A clear breakout above $830 could trigger a strong Bullish Crossover.
💡 What Could Be the Next Big Move? (What's Next?)
Traders should now keep an eye on two scenarios:
* Bullish Breakout: If BNB breaks the upper trend line of this descending channel and the $834 resistance with high Volume, it will be a clear Buy Signal. The next target could easily be $842.51 (24h High) and above.
* Bearish Pullback: If the price pulls back from the current level and breaks the $820 support, the market could re-trace back towards the $801.70 (24h Low). In this scenario, smart traders will wait or keep a tight Stop Loss.