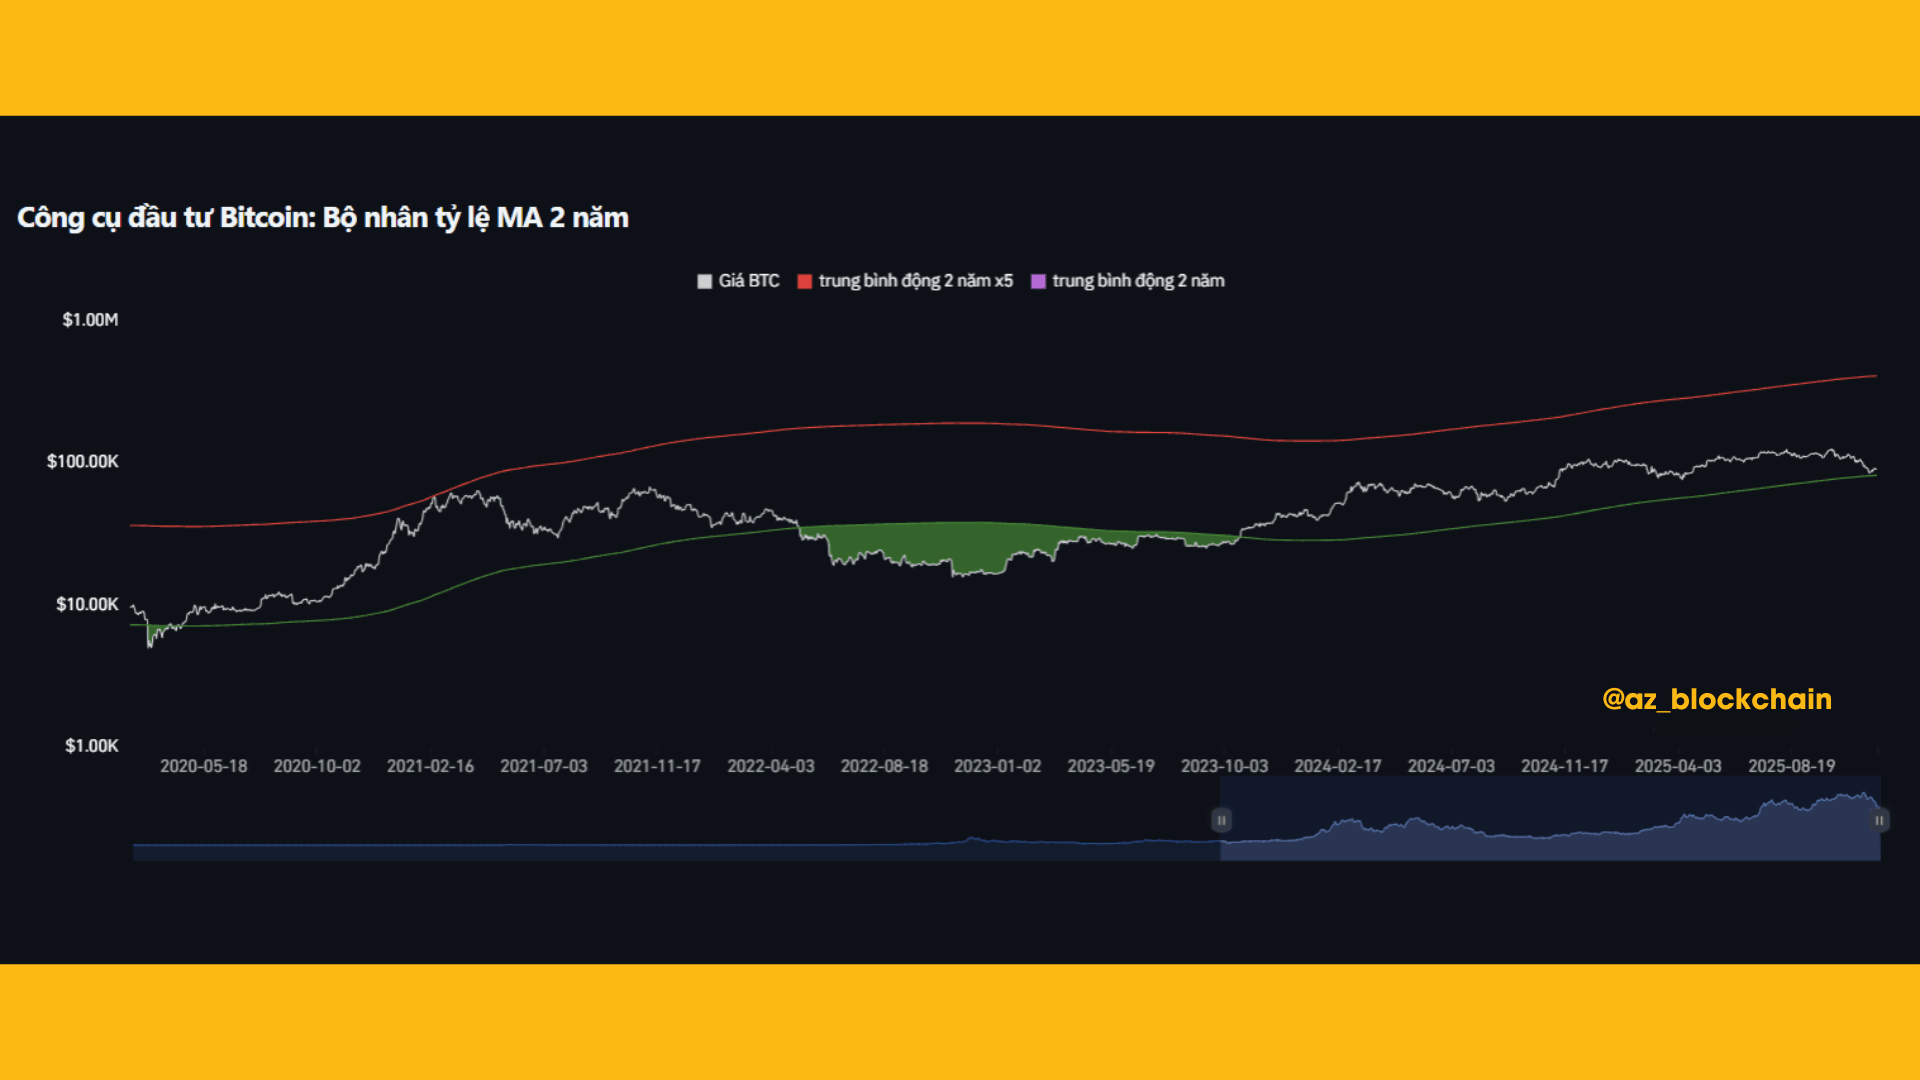
The chart you sent is the Bitcoin Investor Tool – 2-Year MA & 2-Year MA x5, one of the long-standing metrics that helps investors avoid FOMO and identify reasonable price areas for BTC according to the cycle.
📊 1. 2-Year MA (green line) → CHEAP PRICE ZONE / ACCUMULATION
✨When $BTC BTC is below or close to the 2-year MA line → it is usually the best long-term buying area.
✨Historically: BTC touched the 2-Year MA at the bottom in 2015, 2018, 2020, 2022… and subsequently began a new upward cycle.
✨Currently, BTC is approaching the green zone → meaning the valuation is returning to an attractive level.
📈 2. The 2-year MA x5 (red) → OVERBOUGHT ZONE / TAKE PROFIT
✨When BTC approaches or exceeds the red line → the market enters a bubble state, high risk.
✨This is the area where long-term investors often reduce their positions or gradually take profits.
✨Currently $BTC is still far from the red zone → the market is not hot yet, not in the FOMO stage.

🧭 3. Where is the market currently?
✨$BTC fluctuates between two lines → phase transition, similar to 'mid-cycle', not too cheap but not expensive yet.
✨This is a reasonable time for regular accumulation (DCA) instead of going all-in.
✨The long-term trend (multi-year mark) is still steadily increasing, not broken.
🎯 4. For newcomers
✨Not an absolute bottom → but a good price range for long-term investment.
✨No signs of a bubble yet, so the market still has plenty of room to grow in the coming years.
✨The most suitable strategy: DCA + holding BTC/ETH, avoiding altcoin FOMO.
🛑 THIS POST IS NOT INVESTMENT ADVICE, PLEASE REFER TO IT AND ALWAYS STAY CALM IN THE MARKET. 😘
#Bitcoin #MarketUpdate #BTCAnalysis #CryptoLearning #az_blockchain