Core viewpoint
Current price: $91,916 (as of December 3, 09:38 Beijing time)
Short-term outlook: The technical indicators are showing a bullish trend in the short term, with intense long and short competition. The 1-hour and 4-hour cycle indicators show that bullish momentum is dominant, with MACD golden cross in conjunction with RSI close to the overbought area, but the daily level remains in a neutral oscillation pattern. The market is digesting the previous deep correction from above $100,000, and the derivatives market has seen massive short liquidations ($160.4 million in shorts liquidated in 24 hours vs $14.5 million in longs), providing rebound momentum for prices. If the $90,000 level can be maintained in the short term, it is expected to challenge the resistance level of $94,000; however, caution is needed regarding the long-term moving average pressure and the risk of RSI overbought corrections at the daily level.
Key Support:
Recent Support: $89,000-$90,000 (4-hour EMA26 and 1-hour Bollinger Bands lower band)
Secondary Support: $83,900-$85,400 (daily and 4-hour Bollinger Bands lower band, liquidation dense area)
Key Resistance:
Recent Resistance: $93,900-$94,000 (1-hour and 4-hour Bollinger Bands upper band)
Secondary Resistance: $96,000-$96,400 (daily Bollinger Bands upper band and 4-hour SMA200)
Technical Analysis
Multi-cycle Price Structure
The current BTC price is around $91,937, with multi-cycle technical indicators showing a bullish-bearish differentiation trend. The 1-hour level strongly breaks all key moving averages (EMA12 $90,919, EMA26 $89,638, SMA50 $87,559), with the price approaching the Bollinger Bands upper band at $93,904, indicating strong short-term bullish strength. The 4-hour cycle also maintains an upward trend, with the price stabilizing above EMA12 $89,443 and EMA26 $89,241, but still constrained by the long-term pressure of SMA200 $96,419.
The daily level structure is relatively weak, with prices below EMA12 $90,448, EMA26 $93,511, and SMA50 $100,563, indicating that the medium to long-term trend has not yet fully recovered. The current price hovers around the middle band of the daily Bollinger Bands near $90,176, at a key direction selection node.
Technical Indicator Signals
RSI Indicator: The 1-hour RSI (14) reached 69.42, close to the overbought critical value of 70, indicating potential technical pullback pressure in the short term; the 4-hour RSI (14) is at 62.48, in a neutral to bullish range; the daily RSI (14) is only 46.21, slightly bearish but with upward potential.
MACD Indicator: The 1-hour MACD line (1280) is significantly above the signal line (1114), and the histogram expands positively to 166, confirming short-term bullish momentum; the 4-hour MACD line (202) crosses above the signal line (-353) forming a golden cross, with the histogram expanding significantly to 555, providing technical support for medium-term upward movement; the daily MACD line (-3063) is above the signal line (-3997), with the histogram showing 933 indicating potential bottom divergence.
Moving Average System: Short-cycle moving averages show a bullish arrangement (1-hour, 4-hour), but long-cycle moving averages still maintain bearish pressure (daily all moving averages are above the price). The current price must break above $93,511 (daily EMA26) to confirm a trend reversal.
Derivatives Market Dynamics
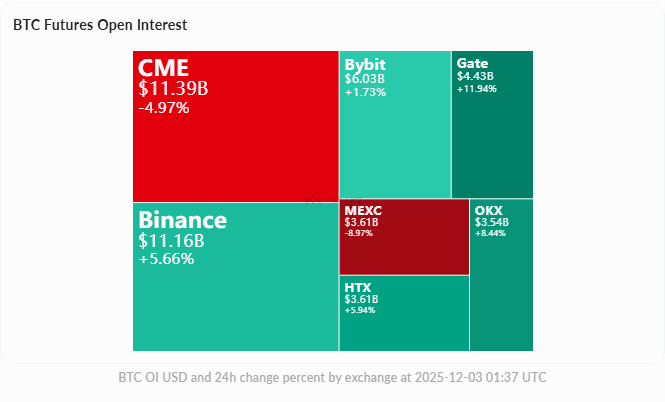
Total position volume reached $59.3 billion, with a 24-hour increase of 2.43%, indicating increased market participation. Funding rates are generally positive (Binance 0.001991%, Bybit 0.000887%), with long positions paying short fees, reflecting a moderately bullish market sentiment.
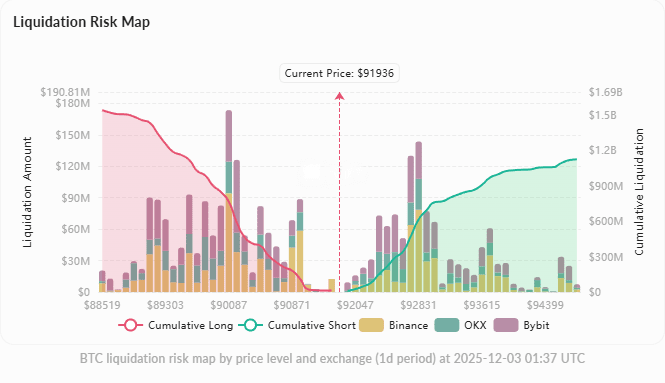
24-hour liquidation data shows extreme differentiation: total liquidations of $174.9 million, among which short liquidations of $160.4 million account for 91.7%, while longs only $14.5 million, confirming that the current rebound is driven by short squeezes. The liquidation dense zone shows accumulation of $1.54 billion long liquidation pressure below $88,519, forming support; while above $94,791, accumulation of $1.12 billion short liquidation forms resistance magnetic absorption effect.
On-chain Data Analysis
Exchange Fund Flows
Data from December 2 shows a net outflow of 3,999.83 BTC from exchanges, continuing a trend of capital withdrawal over two days (with a net outflow of 2,961.54 BTC on December 1). Exchange BTC reserves decreased from 1,826,766 coins on December 1 to 1,822,766 coins on December 2, a reduction of about 4,000 coins, consistent with net outflow data, indicating that some of the coins have transferred to cold wallets or institutional custody, in line with accumulation behavior characteristics.
Note that data for December 3 may have statistical gaps due to the Coinbase wallet migration (starting November 22), with normal recovery expected in mid-December.
Position Distribution Changes
Data from December 1 shows structural differentiation among large holders:
Whales (>10,000 BTC): Holding 2,921,574 coins, down 319 coins daily, indicating slight selling.
Whales (1,000-10,000 BTC): Holding 4,181,790 coins, down 457 coins daily and down 44,104 coins weekly, forming a major selling pressure source.
Sharks (100-1,000 BTC): Holding 5,145,231 coins, down 877 coins daily but up 34,345 coins weekly, indicating mid-term accumulation.
Retail (≤100 BTC): Fish (10-100) increased by 1,856 coins daily, Crabs (1-10) increased by 90 coins daily, Shrimps (≤1) increased by 226 coins daily, indicating continued accumulation on the retail side.
Data reflects a pullback from above $100,000 to below $90,000, during which large holders are realizing profits, while small and medium holders are taking advantage of the pullback to accumulate. Some long-term holders are choosing to use BTC as collateral for loans (collateral ratio 53-57%) rather than directly selling, reducing selling pressure.
Market Sentiment and Narrative
Social Media Sentiment
Current community discussions exhibit a cautiously optimistic tone, focusing on the technical rebound from the $83,000 low and the resistance breakthrough at $87,000-$91,000. The mainstream narrative emphasizes the long-term holding (HODL) philosophy, countering doubts about the cycle peak and MicroStrategy's leverage concerns with historical recovery cases and institutional inflows.
Divergence in Key Opinion Leaders' Views:
KillaXBT maintains a bullish stance, believing that the structural reversal has been completed, analogous to the 2021 consolidation pattern, with December 4 being a key directional node.
Washigorira gives an 80% bearish probability, acknowledging that the weekly stochastic RSI golden cross may bring a rebound, but a breakout of the channel midline must be awaited to confirm the reversal, while pointing out that hidden bullish divergence may continue the short-term upward trend.
PrecisionTrade3 uses Elliott Wave Theory to predict a need to retest the $83,000-$83,600 support to confirm the macro bottom, followed by a potential surge to $103,000-$110,000, with $91,200 being the key confirmation level.
Fundamental Catalysts
Institutional Access Expansion: Vanguard will allow customers to trade cryptocurrency ETFs through third-party platforms starting December 3, and Bank of America plans to recommend a 1-4% BTC ETF allocation to select clients in January 2025, marking a reduction in institutional participation barriers.
Macroeconomic Event Expectations: The market is highly focused on the FOMC meeting on December 10, with historical patterns showing a tendency to rebound before the meeting and a pullback afterward. Pressure in the Japanese bond market and cross signals from the power law model have raised global risk transmission concerns, but the community generally views this as overinterpretation.
Corporate Dynamics: MicroStrategy establishes a $1.44 billion reserve to cover dividends and interest, alleviating market concerns about selling BTC for debt repayment. The stock price of American Bitcoin (ABTC), associated with the Trump family, plummeted by 38.8-40% on December 2, evaporating about $1 billion in market value, negatively impacting market sentiment in the short term.
Trading Strategy Suggestions
Long Position Setup:
Entry Point: Break above $91,900 (1-hour EMA12 confirmation)
Target Price: $94,000 (Bollinger Bands upper band resistance)
Stop Loss: $90,000 (key support)
Risk-Reward Ratio: approximately 1.11:1 (neutral bias)
Risk Warning:
1-hour RSI is close to the overbought area, which may trigger a technical pullback to the $90,000 support.
The daily level is still under long-term moving average pressure, facing EMA26 resistance above $93,500.
If it falls below $90,000, secondary support is in the $83,900-$85,400 range.
Market volatility may increase ahead of the FOMC meeting, and position sizes need to be controlled.
Neutral Scenario: Maintain a range of $90,000-$94,000, waiting for direction confirmation from December 4 and the FOMC meeting. Continuous net outflows from exchanges and retail accumulation provide medium to long-term price support, but the selling pressure from large holders has not been fully released. Aggressive traders are advised to adopt range trading strategies, while conservative investors should observe and wait for a clearer trend.
