Since Monday, Bitcoin's price has increased by 12%, equivalent to an increase of about $10,000. However, this king of cryptocurrency has not completely escaped danger. The current price is facing horizontal resistance, and there is also a major downward trend line overhead, indicating that bulls still need to work hard.
Is the $10,000 increase lacking momentum?
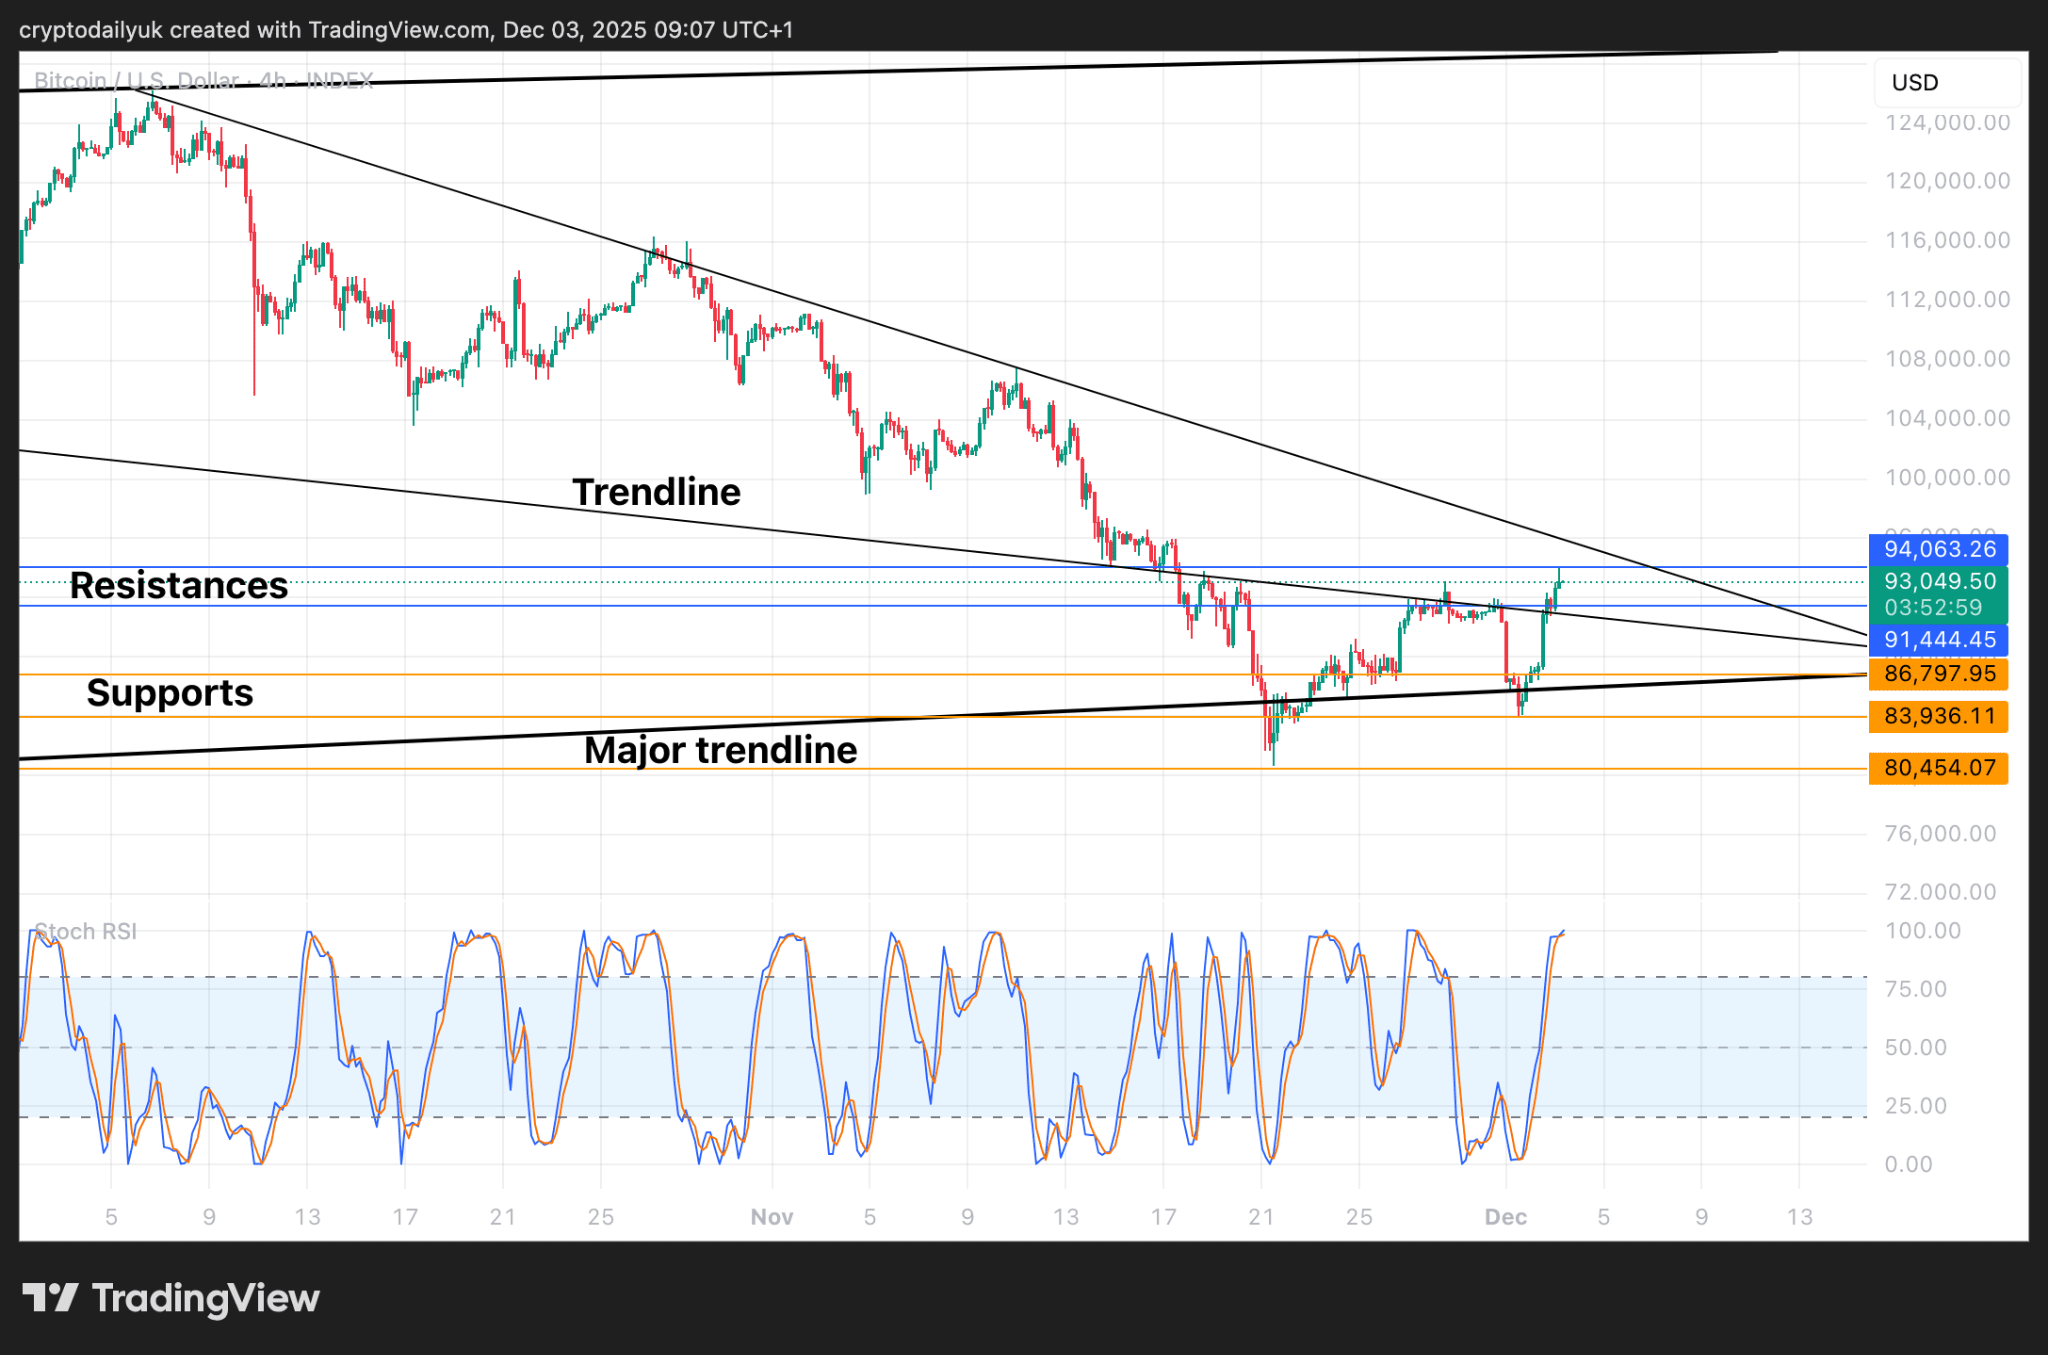
On Tuesday, Bitcoin bulls made a strong rebound, which is just what the market situation needed. Bitcoin's price briefly fell below the main trend line, and the previous low of $80,000 seemed precarious.
However, the bulls acted quickly, and the price surged by $10,000. This wave of increase pushed the price back above the main trend line, breaking through another downward trend line and resistance level, ultimately possibly lacking momentum near the horizontal resistance level of $94,000.
Perhaps this wave of rising still has momentum enough to break through the current resistance level, or even retest the major descending trend line. That being said, this wave of rising is indeed strong, and short-term momentum indicators are also beginning to approach their peak.
For bulls, the best-case scenario right now may be for prices to consolidate sideways for a few days to make a correction. The opposite scenario would be for prices to break below the major trend line.
Is it necessary to confirm the W-shaped pattern next?
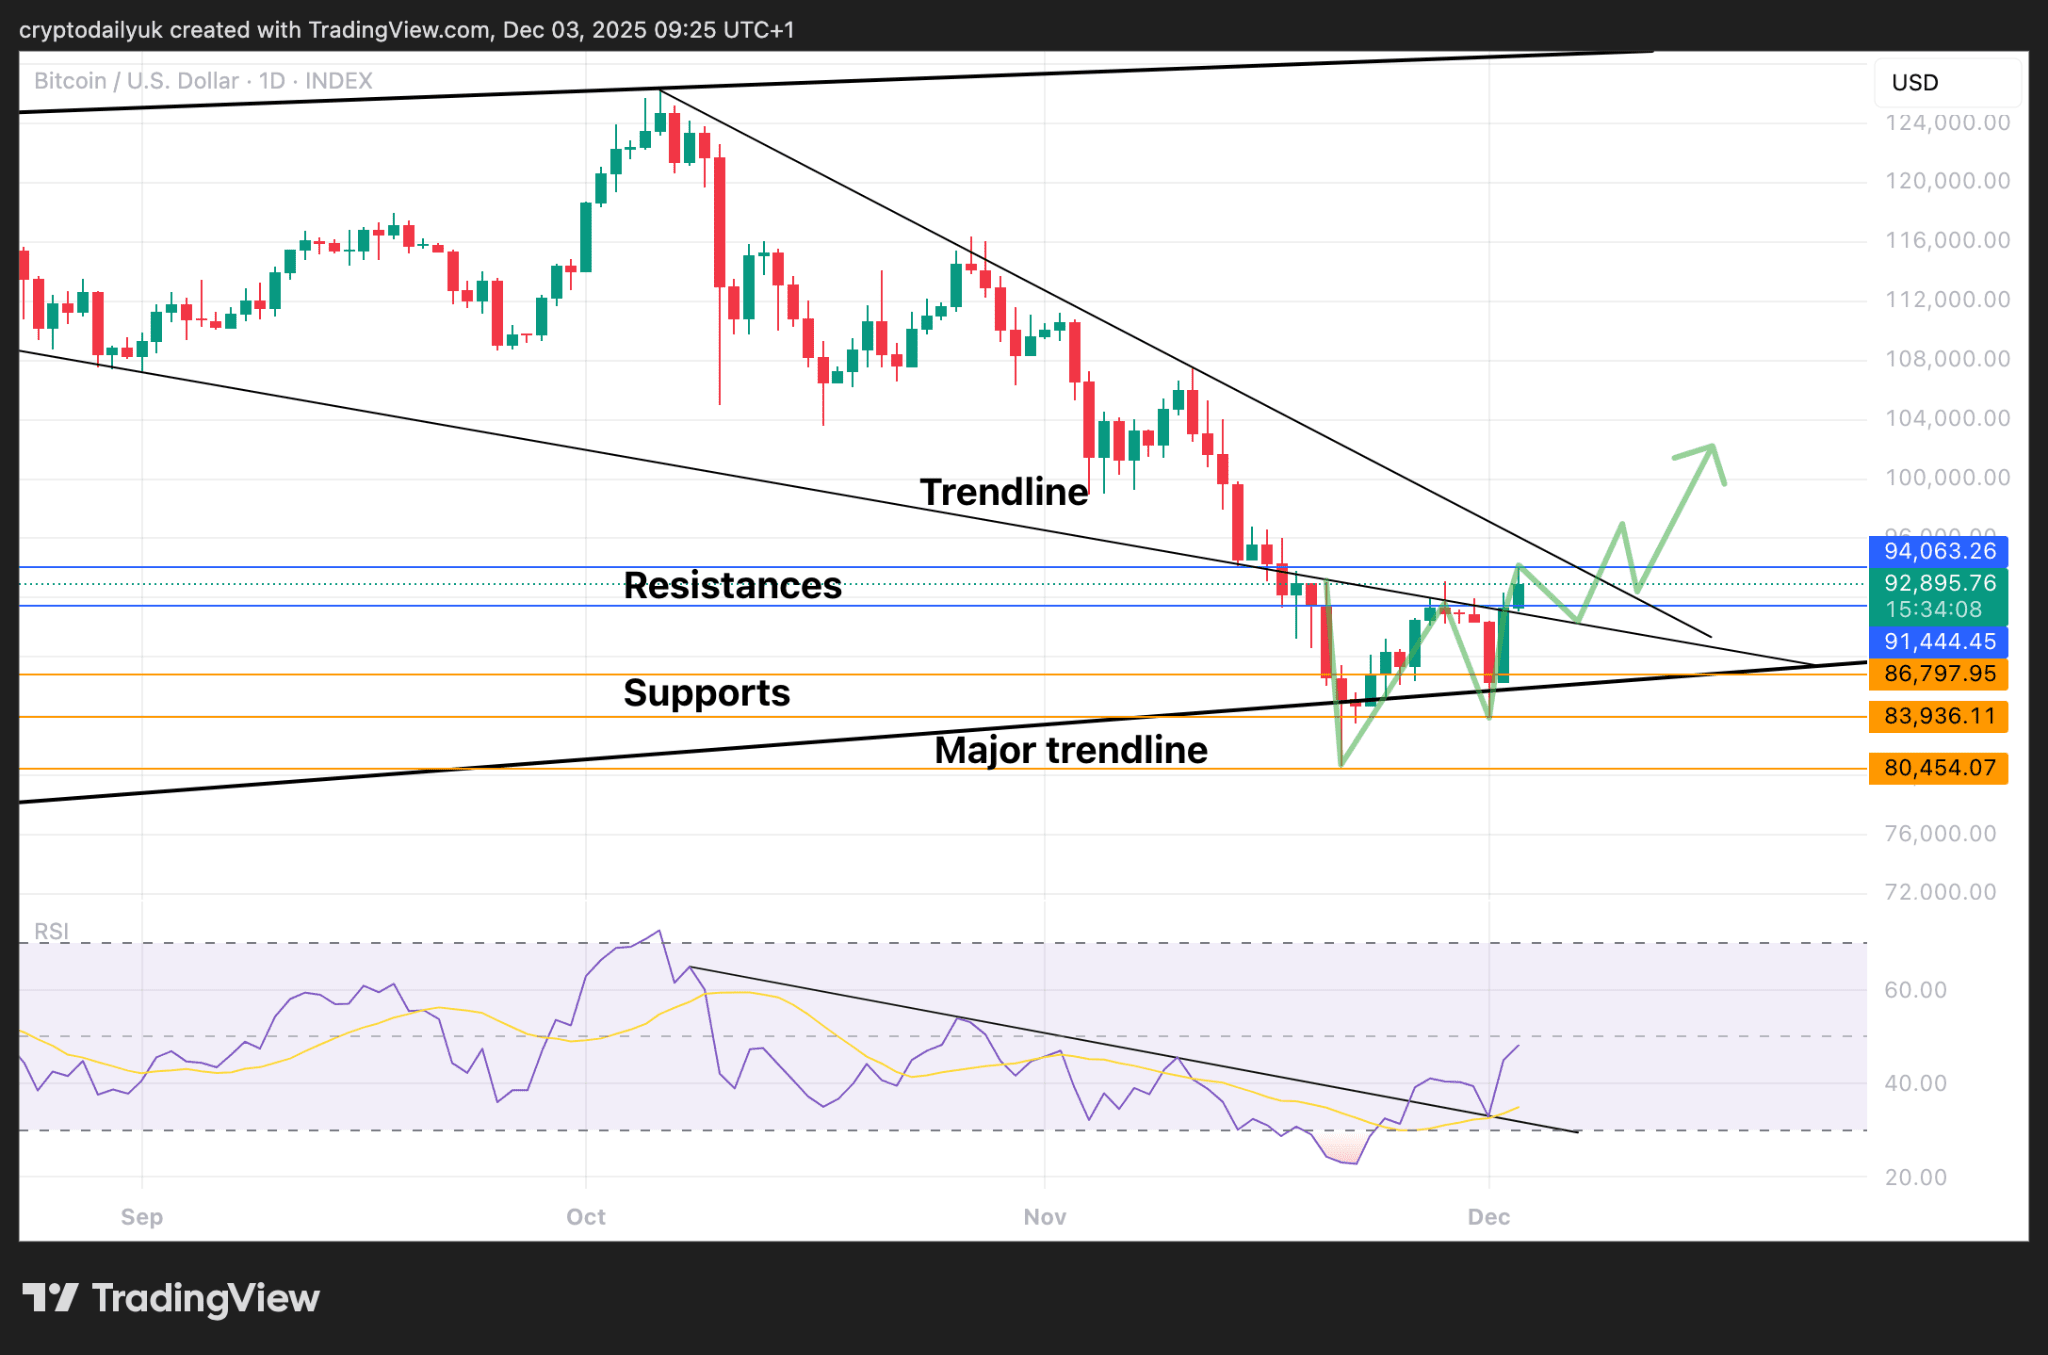
The daily chart shows that the W shape pattern is still forming. As shown, the W shape has formed, and the Bitcoin price has also broken through the neck line. The next logical movement is for the price to pull back near the neck line for testing to confirm the pattern.
At the bottom of the chart, the RSI indicator remains in a positive trend. The indicator line has broken through the descending trend line and has tested and confirmed the breakout. This is a very good signal for price movement, as price action typically follows the trend of the RSI indicator.
Is the BTC price in a huge wedge pattern?
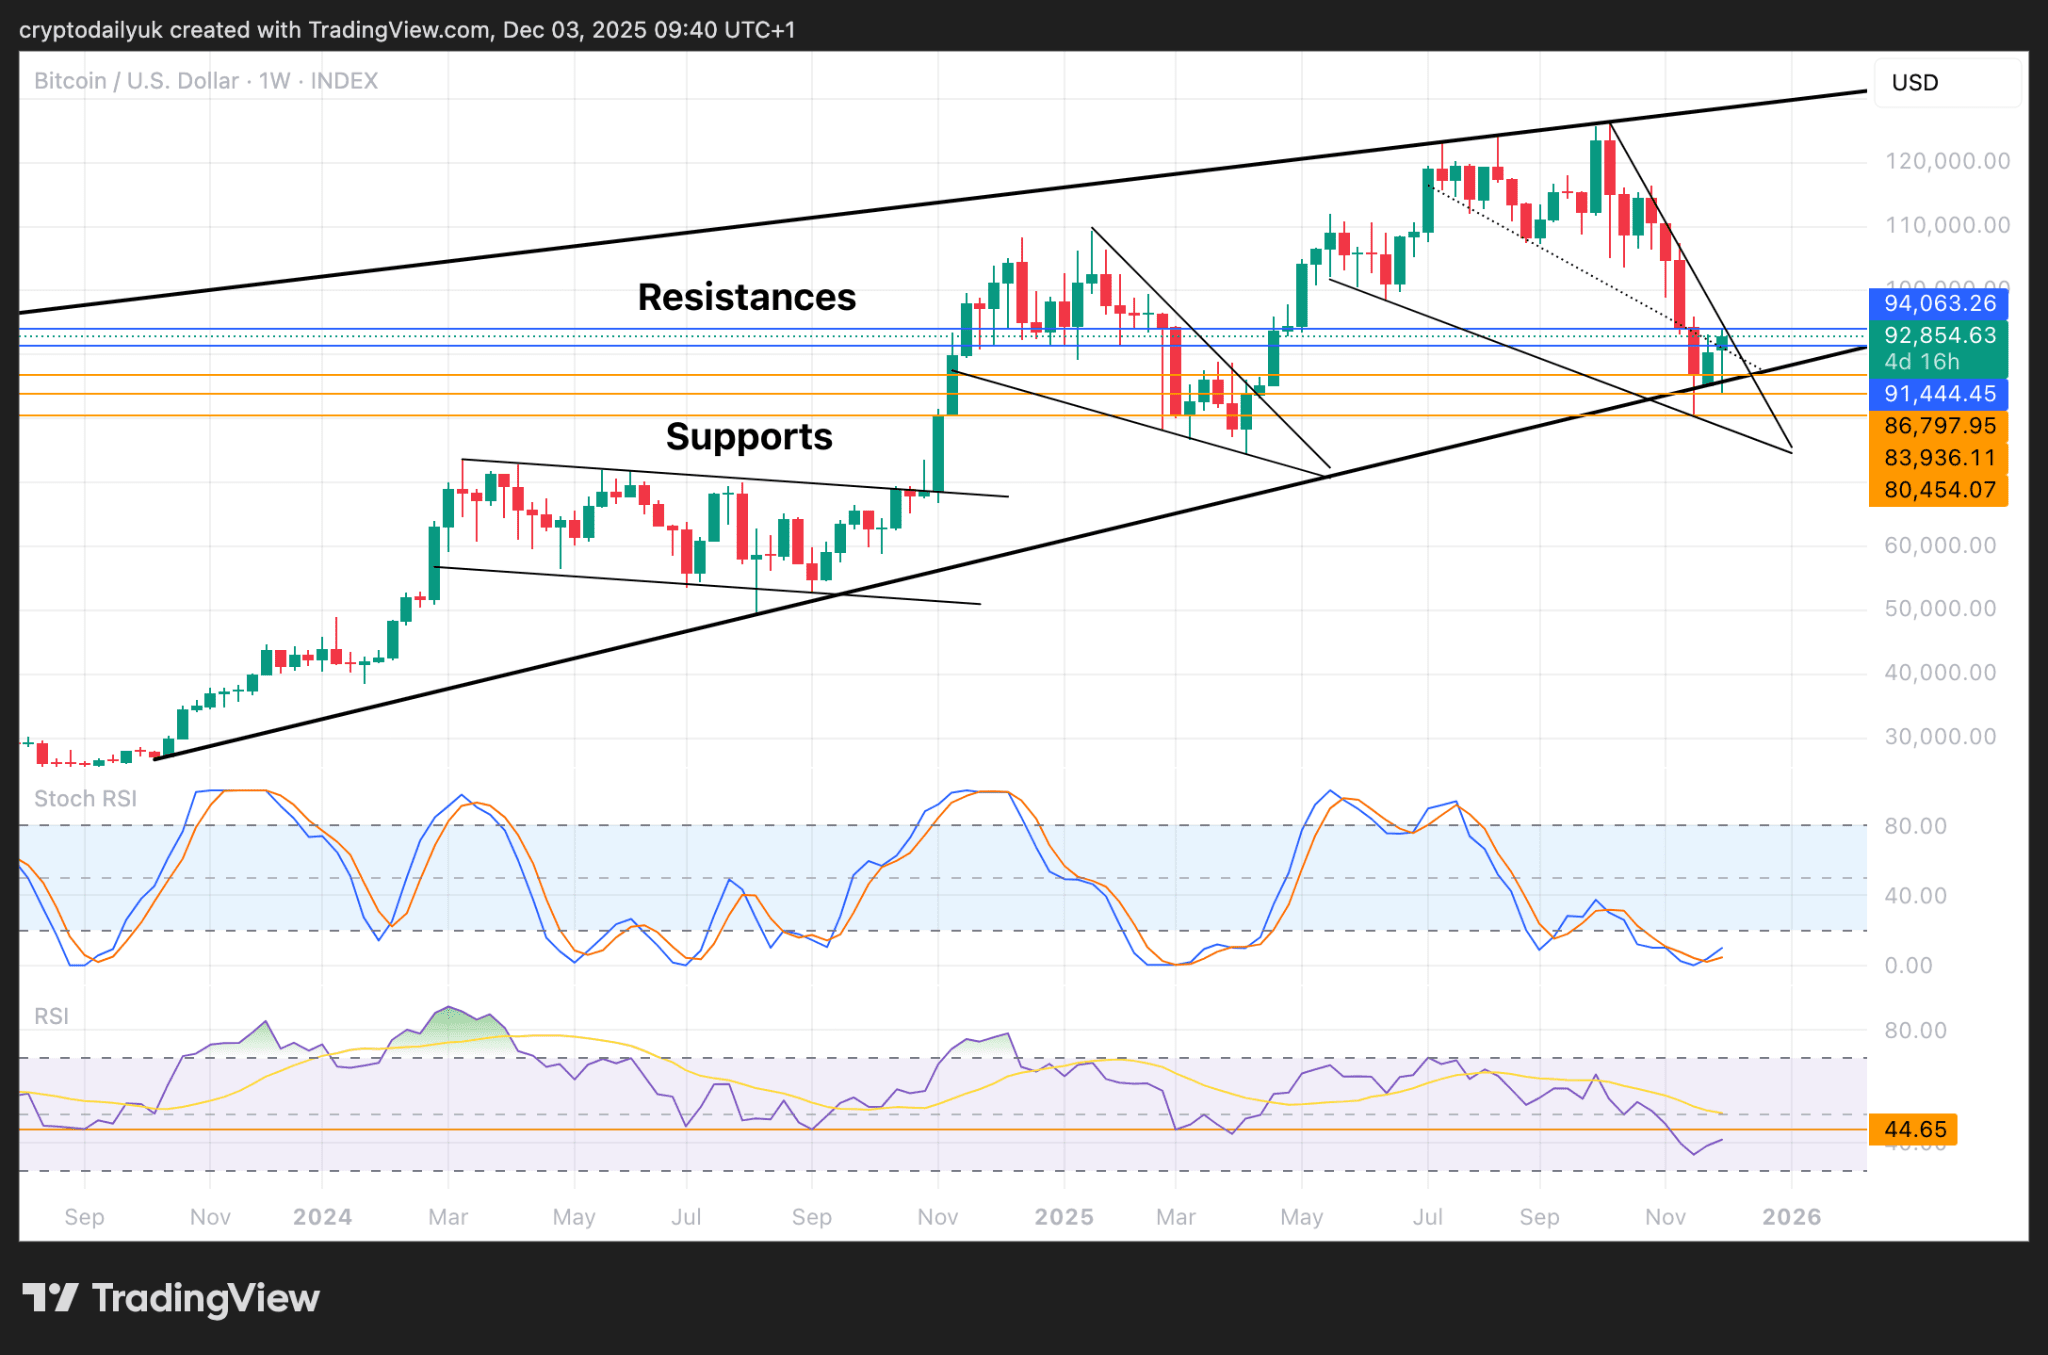
From the weekly chart and the major patterns formed in this bull market, the current price trend may form a larger wedge pattern than before. Given that prices often break through these patterns before they end, this makes the current wedge pattern likely to overlap with the major upward trend line. Prices typically break upward from a descending wedge pattern.
At the bottom of the chart, the stochastic relative strength index (Stochastic RSI) first crosses upwards, and if the indicator line exceeds the 20.00 level, it indicates that prices will experience strong upward momentum.
The relative strength index (RSI) shows some concerning signs. The indicator line has fallen below the level typically associated with bear market activity. If this is just an illusion, it would be a big mistake; bulls need to genuinely initiate a wave of rising to pull the indicator line back above the key support level of 44.00.
In addition, the overall situation remains balanced. Bitcoin has been on the edge of a cliff, and any drop could have catastrophic consequences. However, it seems that signs of market recovery have matured, and the possibility of returning to historical highs is increasing.
