
While some analysts are calling for a crash to $25,000, one key metric suggests Bitcoin may have a much stronger support zone than most traders expect.
⚡ The clue comes from Bitcoin's Electricity Cost Model a metric that estimates the minimum production cost required for miners to generate new BTC.
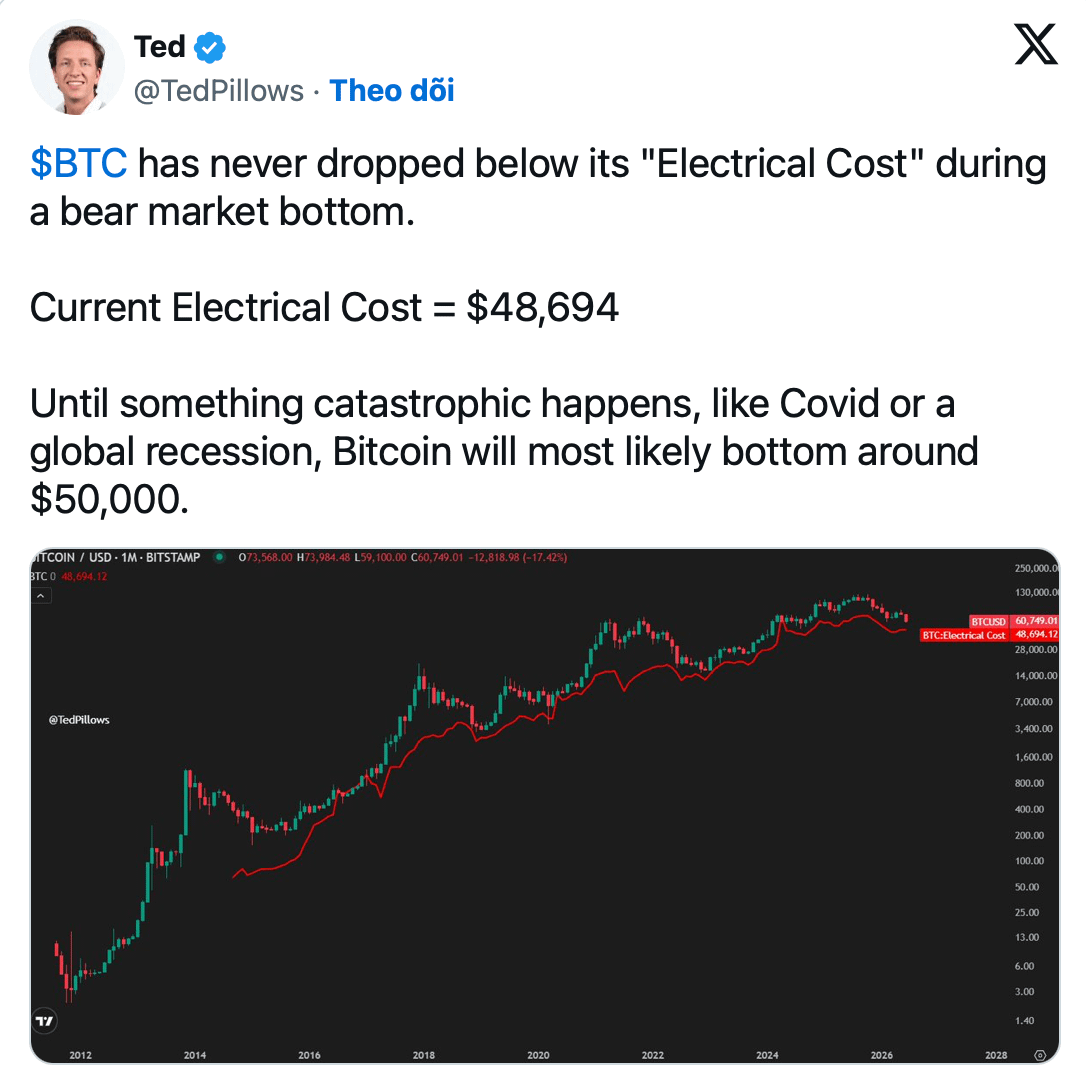
Historically, Bitcoin bear market bottoms have rarely stayed far below mining production costs for long periods.

📊 Current estimated $BTC electricity cost: $48,694
That places the market's potential long-term support zone around $48K–$50K.
This doesn't mean BTC can't wick lower during a panic event, but it does suggest that a collapse toward $25K would likely require an extreme global shock similar to the COVID crash or a severe economic crisis.
Meanwhile, on-chain data is sending mixed signals:
🔻 RSI remains deeply oversold 🔻 Death Cross has appeared on major moving averages 🔻 Open Interest remains elevated, keeping long-squeeze risk alive
But there's one bullish signal worth watching:
🐋 Bitcoin continues leaving Binance.
Netflows remain negative, indicating investors are moving BTC off exchanges rather than preparing to sell. Historically, sustained exchange outflows often signal accumulation rather than distribution.
📍 Key levels to watch:
• Support Zone: $48.7K–$50K • Major Risk: Long liquidations if leverage remains high • Bullish Signal: Continued exchange outflows and spot accumulation
The market may still have pain ahead, but if history rhymes, the region around $50K could become one of the most important accumulation zones of this cycle.
Do you think BTC finds a bottom near $50K, or are bears targeting something much lower? 👇