Key Insights
Current price: $93,648 (as of December 4, 10:15)
Short-term Outlook: Bullish bias, technicals show a 4-hour MACD golden cross and funding rates remain positive. Expected to test the $95,000-$96,000 area within 24-48 hours. The probability of a breakout is about 60%, mainly driven by short-squeeze pressure (over the past 24 hours, short liquidations of $69.94M exceeded long liquidations of $42.80M) and continued outflows from exchange reserves (7-day net outflow of approximately 15,000 BTC). If the 1-hour RSI is excessively extended or volume fails to cooperate, a brief pullback to around $93,000 may occur.
Key Support:
Recent support: $93,000 (1-hour Bollinger middle band)
Strong support: $90,000-$90,200 (daily Bollinger middle band + large long liquidation cluster)
Extreme support: $84,000 (daily Bollinger lower band)
Key resistance:
Recent resistance: $93,800-$94,000 (1-hour Bollinger upper band + short liquidation cluster)
Strong resistance: $95,900-$96,400 (4-hour/daily Bollinger upper band)
Historical high: $126,080 (October 6, 2025)
Technical analysis
Multi-cycle indicator status
1-hour level
RSI(14): 61.97, neutral to slightly overbought region
MACD: slight death cross (histogram -90) appears, but the price is still above EMA(12) $93,187 and EMA(26) $92,614, short-term upward trend is not broken
Bollinger Bands: price is close to the upper band $93,838, middle band $93,016 provides immediate support
4-hour level
RSI(14): 66.50, close to overbought but shows continued buying interest
MACD: strong bullish arrangement, histogram +534 and continuing to expand, upward momentum strengthens
Price is above all key moving averages (EMA12/26, SMA50), bullish structure is complete
Daily level
RSI(14): 49.58, neutral balanced state
MACD histogram turns positive to +1,188, indicating potential bullish divergence
Price is in the upper-middle of the Bollinger Bands (middle band $90,205, upper band $96,391), may choose a breakout direction after consolidation
Volume and on-chain data
OBV indicator: 1-hour level +16,579 indicates moderate accumulation at the hourly level, but 4-hour (-80,348) and daily (-234,096) are still negative, reflecting ongoing distribution pressure in the medium to long term.
Exchange outflow: December 3 single-day net outflow -2,327 BTC, cumulative about -15,000 BTC over 7 days, total exchange reserves dropped to 1,820,439 BTC ($170.07B), showing that institutions and large holders continue to hoard coins.
No significant volume spike in the past 24 hours, current consolidation trend is dominant.
Derivatives market
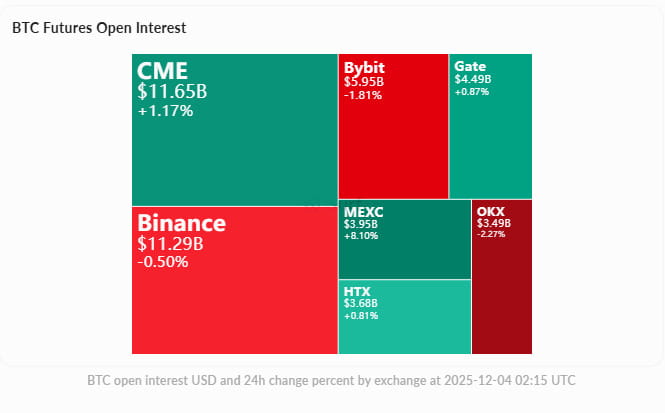
Open interest in futures
Total open interest: $60.03B, 24-hour slight increase +0.21%; among major exchanges, Binance $11.29B (-0.50%), Bybit $5.95B (-1.81%) slightly decreased, showing a slight contraction in leverage exposure.
Funding rate
Funding rates across exchanges are generally positive: Binance +0.000294 (8-hour settlement period), Bybit +0.001145, indicating that longs pay shorts, market sentiment is bullish. The next funding rate settlement time is December 4 at 16:00 (Beijing time).
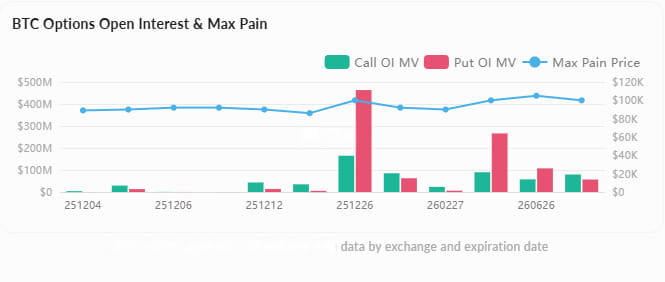
Options market
Total open interest in options: $55.26B, up +1.93% in 24 hours; maximum pain points concentrated at recent expiration dates (like December 5) at $90,000 and further out (March 2026) at $100,000, these positions may create a magnet effect on price.
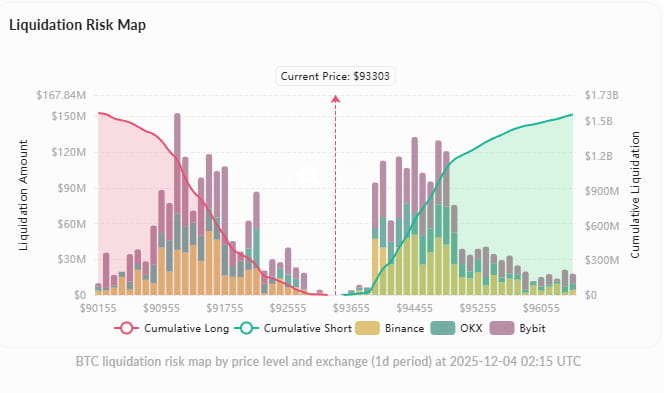
Liquidation risk analysis
Total liquidation amount in the past 24 hours is $112.74M, with short liquidations of $69.94M far exceeding long liquidations of $42.80M, showing that shorts are continuously squeezed during price rises.
Liquidation heat map shows:
$90,155 area accumulates long positions of about $1.57B, lower support under pressure
$93,955 area accumulates short positions of about $1.15B, upper resistance liquidation area
If it breaks above $94,000, it will trigger a large number of short liquidations, potentially accelerating the rise to the $95,000-$96,000 range
Market sentiment and narrative
Institution dynamics
Vanguard shift: allowing 50 million customers access to crypto ETF products, marking a significant change in the stance of traditional financial institutions
ETF fund inflow: on November 25, Bitcoin ETF net inflow of $57.6M, BlackRock iShares Bitcoin Trust trading volume significantly increased, although GBTC continues to see outflows
High-level attitude shift: BlackRock CEO publicly admits previous misjudgment of Bitcoin, enhancing institutional adoption confidence
Social media sentiment
Overall presenting a mixed optimistic posture:
Bullish narrative dominates social media discussion volume, core driving factors include: SEC Chair predicts that the crypto market structure bill will pass; potential $20 trillion liquidity injection expectation from the Trump administration; technical weekly chart shows hidden bullish divergence
Bearish voices focus on on-chain indicators (CryptoQuant CEO points out that overall on-chain data is bearish and relies on macro liquidity), Bitcoin dominance rising channel may form bearish setup, Ichimoku cloud analysis suggests risk of trend reversal
The Fear and Greed Index is in the "extreme fear" zone. Historically, such extreme emotions often correspond to contrarian opportunities.
Key price events
V-shaped rebound from the December 1 low of $84k-$87k +10-11% to the current $93k, creating the strongest daily bullish candle since May
Recently broke through $91,000, $92,000, $93,000, and $94,000 integer levels continuously, showing buying momentum
Next important resistance level $96,000 (close to the upper Bollinger band and historical trading dense area)
Trading strategy recommendations
Long strategy
Entry range: $93,600-$93,800 (confirm stabilization above 1-hour EMA12)
Target level: $95,000 (4-hour Bollinger upper band), aggressive target $96,400
Stop-loss level: $93,000 (1-hour Bollinger middle band)
Risk-reward ratio: approximately 1.86:1 (good)
Short strategy (only applicable in case of breaking support)
Entry condition: break below $92,195 (1-hour Bollinger lower band) and confirm
Target level: $90,205 (daily Bollinger middle band)
Stop-loss level: $93,000
Risk-reward ratio: approximately 1.80:1 (good)
Profit-taking management
Long positions are close to $96,391 (daily Bollinger upper band) gradually reducing positions
Be cautious of reversals when funding rates turn negative or volume shrinks abnormally
After breaking upward, move the stop-loss to $93,800 to protect profits
Risk warning
Technical divergence: 1-hour MACD shows a death cross and the daily is still below long-term moving averages (SMA50 $100,251, SMA200 $109,444), the medium to long-term downtrend structure has not been completely reversed.
Liquidation cluster risk: cumulative $1.57B long liquidations below $91,000, if support is lost, it may trigger a chain decline.
Macro uncertainty: market has divergent views on the Federal Reserve's policy path, yen carry trade liquidation, and global liquidity expectations.
Extreme sentiment: volatility may intensify under the "extreme fear" state of the Fear and Greed Index.
Summary
BTC is currently in a key consolidation range ($93,000-$94,000), technical 4-hour level shows a clear bullish structure, combined with positive funding rates, short squeeze effect, and continuous outflow of on-chain funds from exchanges, in the short term (24-48 hours) is inclined to test the $95,000-$96,000 resistance area, with an upward breakout probability of about 60%.
However, note that there is still distribution pressure at the daily level (OBV negative value) and it is below the long-term moving average. A shift to a bullish medium to long-term trend requires a breakthrough and stabilization above $96,000. Aggressive investors may consider positioning long in the $93,600-$93,800 range, targeting $95,000-$96,000, with a strict stop-loss at $93,000; conservative investors may wait for a breakout above $94,000 with volume confirmation before following up.
If it breaks below $92,000, the short-term bullish logic will be invalidated, requiring reassessment of the reaction to the $90,000 support area.
