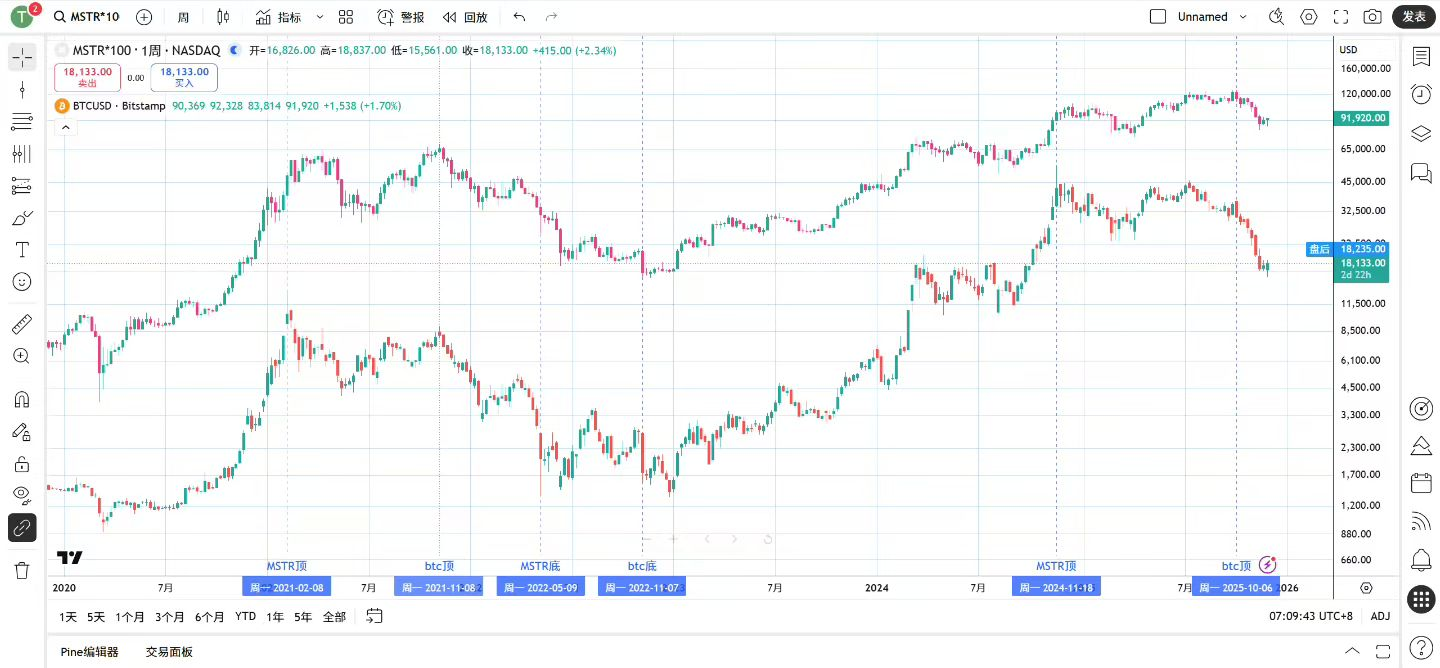
By comparing the weekly K-line of btc and MSTR, it can be seen:
2021
MSTR hit a major peak on 2021-02-09
Btc hit a peak on 2021-04-14 (coinbase went public)
64 days in advance
MSTR hit a secondary peak on 2021-11-09
Btc hit a major peak on 2021-11-10
On the same day (according to US stock time)
2022
MSTR hit a bottom on 2022-05-12 (USD continuous interest rate hikes)
Btc hit a bottom on 2022-06-18
37 days in advance
MSTR hit a major bottom on 2022-12-30
Btc hit a major bottom on 2022-11-21 (FTX collapsed)
39 days delayed
2025
MSTR hit a major peak on 2024-11-21 (Trump won the election on November 6)
Btc hit a peak on 2025-01-20 (Trump's inauguration on January 20)
60 days in advance
MSTR saw its second peak on 2025-07-16
Btc saw a major peak on 2025-10-06 (07-14, 08-14, 10-06 extended wedge top)
82 days in advance
Looking through the market rhythm from the two-round cycle (2018–2021, 2022–2025)
1. MSTR = BTC's 'leverage leading indicator'
MSTR follows 'expectation', BTC follows 'realization'
The sophistication of capital operations in the US stock market is vividly displayed here
MSTR relies on corporate leverage (huge BTC holdings + debt financing) to amplify volatility, reacting to policy/macroeconomic/event shocks much faster than BTC itself
MSTR leads 30-80 days at 60-80% key turning points
Earlier, faster, more extreme
MSTR's turning point is almost the frontline of major capital risk appetite changes
2. This round of BTC bull market will end in October 2025
From the major bottom in 2022 to now, this round of bull market has increased over 800% in four years (BTC from 1.55W to 12.6W)
But the turning point of the market is actually in 2024
In November 24, MSTR was the first to see a major peak (trading election expectations)
In January 25, 60 days later, BTC will see an emotional peak (realization of employment commitments)
Subsequently, with tariffs and TACO trading, BTC made an extended wedge triple top in July/August/October, barely reaching a new high
If only looking at BTC, one would think 'it can push again'
But looking at MSTR will not hesitate:
MSTR has reached a maximum drawdown of 71.26% from this round's high point
Confirmed to enter a bear market
BTC has just completed the first leg of the decline
The cycle has ended; in the future, BTC should not be priced with a 'bull market mindset', but should enter a 'bear market framework'
3. In the future, to bottom out BTC, one can 'feel the way across the river with MSTR'
From historical patterns, MSTR's rhythm mostly leads BTC
And MSTR's bottom is usually earlier, sharper, and clearer
Strategy:
Do not predict the bottom of BTC, observe MSTR's downward trend and extreme capitulation
In the last bear market, MSTR dropped by 89.92%
Most of it has dropped in the 6 months of 2022
Currently, MSTR has dropped 71.26%
Most of it has dropped in the last 4 months
Although BTC is still in the first leg of the decline
But if MSTR falls again on the weekly chart, it will hit the bottom
According to MSTR's downward sequence, drop rate, and possible capitulation
After MSTR shows a bottom, BTC's bottom is likely to appear within 40 days