I found that many people often experience confusion during the learning process of trading because there are simply too many trading methods available in the market. They don't know which method can effectively improve their trading skills or what they should learn.
In the early days, I also learned hundreds of methods, but in the end, only two or three could be distilled and applied to my trading system.
In technical analysis, there are some trading rules that have been validated many times. These rules can help us find trading opportunities with higher accuracy and more favorable risk-reward ratios.
Today, I have organized 6 very practical trading rules from my past trading experience, including those I am currently using, which improve entry success rates, breakout success rates, and profitability. I believe they will provide substantial help.
1. The 123 rule
The 123 rule has a particularly high usage rate in technical analysis, and my own trading system also encompasses this rule.
This rule is an extension and application of Dow Theory, most commonly used to confirm trend reversals and as an entry signal. With simple quantification, it can be readily applied. Even mastering the 123 rule can create a complete trading system.
Therefore, this rule is very fundamental, practical, and effective, worth learning. Next, I will discuss the shape and application of this rule for your convenience.
The shape of the 123 rule:
This pattern resembles the letter 'N'. For example, after a continuous decline, the market meets resistance and forms a retracement. This is 1; after the retracement ends, the market declines again without breaking the previous low of 1. This is 2; after 2 completes, the market restarts the bullish trend and breaks the high of 1. This is 3.
The entire pattern resembles a right-sided low N shape. Let me explain with an image.
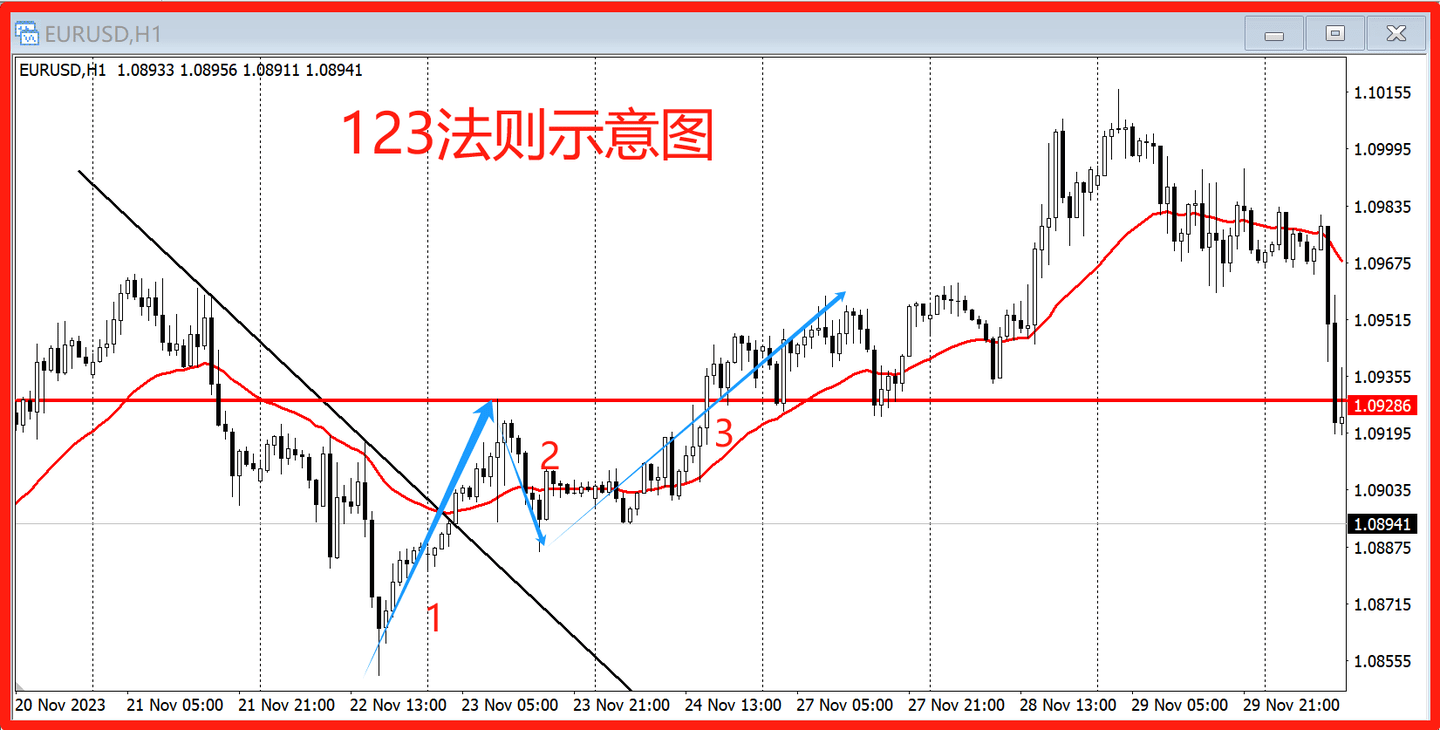 The chart shows the 1-hour candlestick chart of EUR/USD.
The market fell from the high point of 1.09600 to 1.08500. After a significant drop and stabilization, it began to reverse upwards. First, it broke through the black downtrend line in the chart (the first upward blue arrow, this is 1), then retraced to 1.09200 (the second downward blue arrow, this is 2), and the market again broke through the high point of 1.09200 (the third upward blue arrow, this is 3). The entire blue arrow forms an N shape.
Application of the 123 rule:
A: Confirm the trend reversal.
According to Dow Theory's definition of trends, an upward trend refers to the market rising, with pullbacks not breaking previous lows, continuing to break previous highs. A downward trend refers to the market falling, with pullbacks not breaking previous highs, continuing to break previous lows.
The market trend continues in an N-shaped structure of rises and falls, or falls and rises.
Thus, at the end of this upward trend, a downward 123 structure emerged, which can be understood as a reversal of the bullish trend. At the end of a downward trend, an upward 123 structure emerged, which can be understood as a reversal of the bearish trend.
Everyone, take a look at the diagram below.
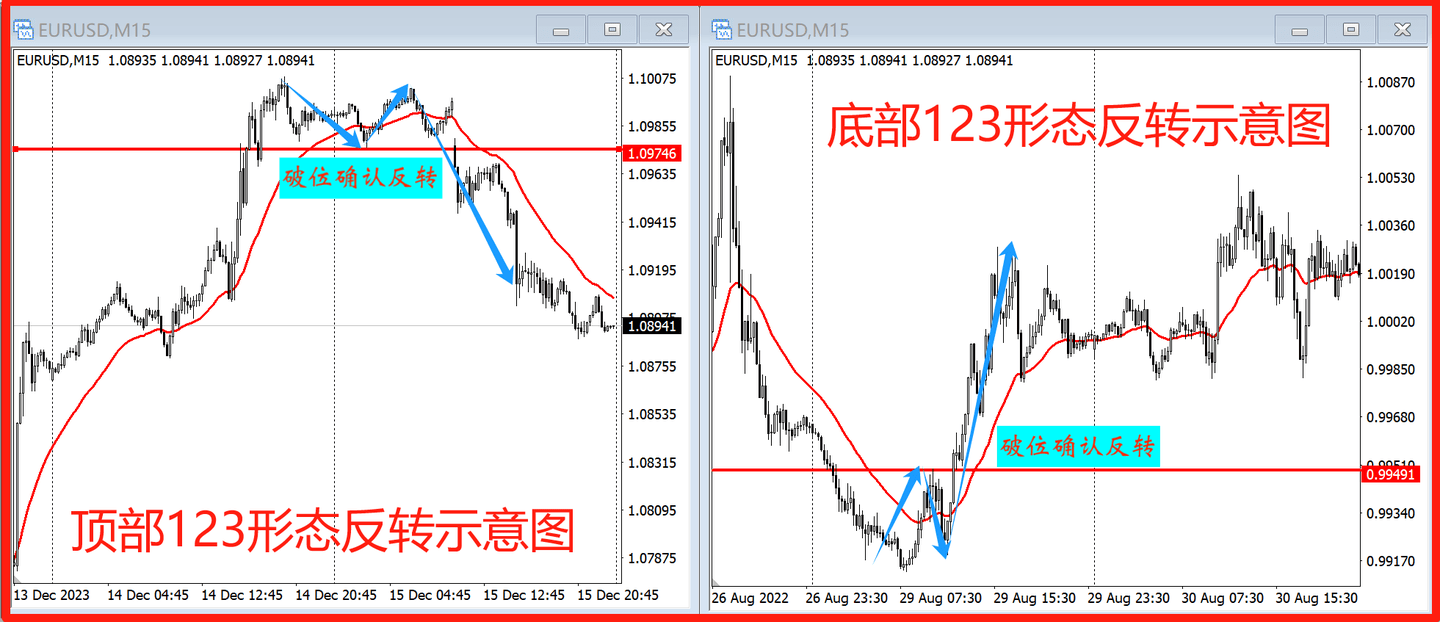 The chart shows the candlestick chart of EUR/USD, with both the left and right sides being 15-minute candlestick charts. The left side is a diagram of the top 123 pattern reversal.
After a significant rise, the market pulls back. When the pullback ends, if it fails to break the previous high on the second upward attempt and subsequently breaks the previous low, it confirms a trend reversal.
On the right side is a diagram of the bottom 123 pattern reversal. After a significant drop, the market pulls back upward, and when the pullback ends, the second drop does not break the previous low, then reverses upwards and breaks out, confirming the trend reversal at the previous high.
B: Used as an entry signal.
The shape of the 123 rule confirms the trend reversal, and the confirmation points for the reversal are the breakout of the high or low point of 1 at the 3 breakout point. Therefore, the breakout point can be used as an entry signal for trading. In practical applications, this method can also be used in double timeframe trading.
Let me explain with an image.
 The chart shows the candlestick chart of EUR/USD. The left side is the 4-hour candlestick chart, and the right side is the 15-minute candlestick chart.
On the left side, the market tests the previous high resistance near 1.10100, with a possibility of reversal. At this time, switch the candlestick chart to the 15-minute level. When the right side shows a downward breakout of the 123 pattern, enter short, setting the stop loss at the previous high, and then the market drops significantly.
Notes on the use of the 123 rule:
(1) Applicable to different timeframes.
Dow Theory's definition of trends applies to different timeframes. Therefore, the 123 rule can also be used in different candlestick cycles, such as daily, hourly, and minute charts.
(2) Many top and bottom reversal patterns meet the standards of the 123 pattern.
In many reversal patterns, the 123 rule pattern is part of the top and bottom reversal, such as in the right shoulder of a double top/bottom or head and shoulders top/bottom, which usually forms a 123 pattern structure.
Also, in the 15-minute candlestick chart above, the 123 entry pattern is also a double top structure.
(3) There are also some more aggressive methods in practice.
For example, after 1 breaks out, try to enter at the low point of the 2 pullback to trade the reversal of 3, which allows entry at the starting point of the 2 wave, with a small stop loss and good risk-reward ratio. At the same time, when 3 breaks down, you can add to your position.
2. The 2B rule
The 2B rule is a variant of the 123 rule. This pattern can also be used to judge trend reversals and as an entry signal. Moreover, this pattern has a high success rate and an ideal risk-reward ratio in practical applications. Why is that? Let me explain the definition of this rule, and you will understand.
2B rule's pattern:
The English name of the 2B rule is Twice Breakout, meaning two breakouts. As the name suggests, there are two breakouts in this pattern.
Taking the bullish scenario as an example, when the price has risen significantly and forms a new high point A at a high level, then the market pulls back and creates a low point B. The market quickly shoots up again to form a new high point C, but the bullish trend cannot be sustained and quickly turns bearish again, breaking down through the previous high point A. When it breaks through the previous high point A, it forms the second breakout point, which is the breakout point of the 2B pattern.
The bearish pattern is a mirror image of the bullish pattern. I won't elaborate further; I'll explain the bearish reversal of the 2B rule with an image.
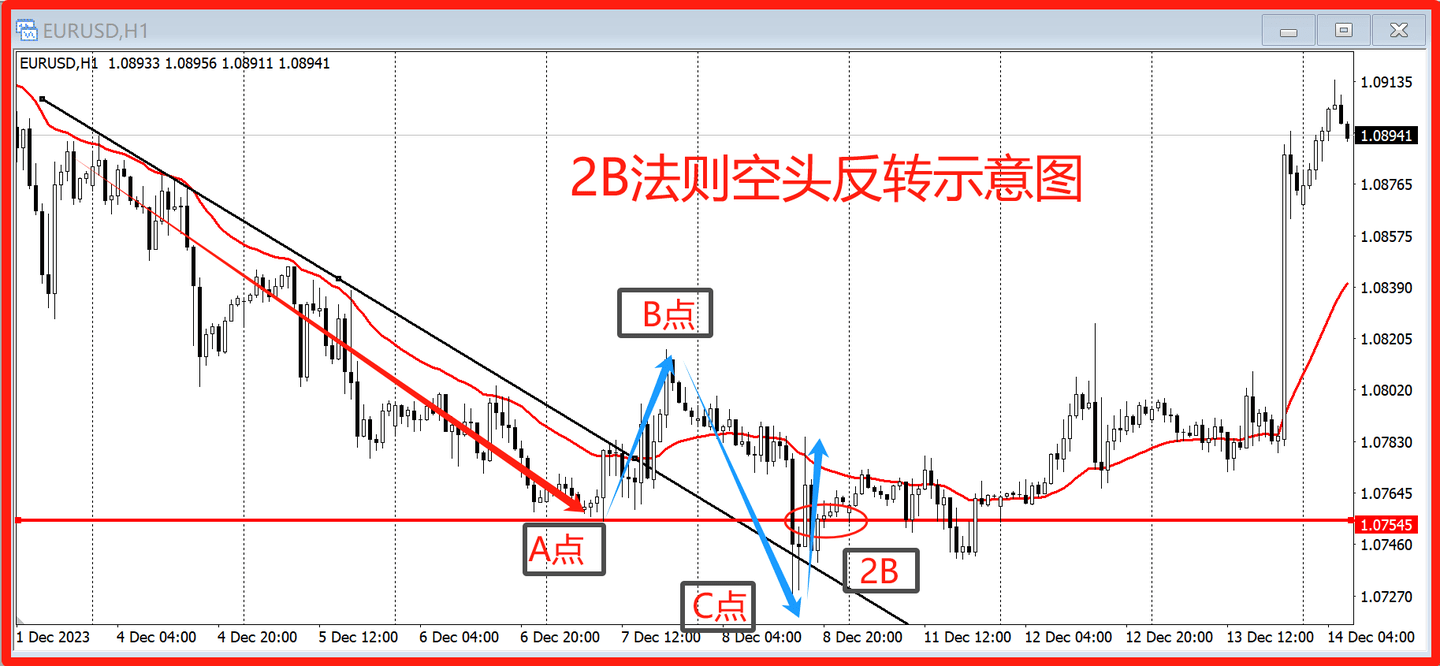 The chart shows the 1-hour candlestick chart of EUR/USD.
After a continuous significant drop, the market forms a new low at point A, then pulls back from point A to create a high at point B. The market again breaks down from point B to form a new low at point C but cannot continue the bearish trend, quickly reversing. When the bullish trend breaks through the price level at point A, it forms the breakthrough of the 2B pattern.
This pattern essentially represents a significant drop, where the market breaks down at a low point to induce a short position, followed by a quick reversal structure of a false breakout.
(1) After a significant drop, the market quickly induces shorts, and the probability of reversal after a false breakout is very high.
(2) The breakout point of the 2B is the first resistance point after the false breakout and is the best entry point second only to the reversal point. The stop loss space is small, and after the market reversal, the risk-reward ratio is very high. Therefore, the success rate of the 2B pattern is high, and the risk-reward ratio is good.
Application of the 2B rule:
After the market tests important support and resistance levels, directly enter the market using the breakout point of the 2B rule, set the stop loss, and engage in trend trading.
Let me explain with an image.
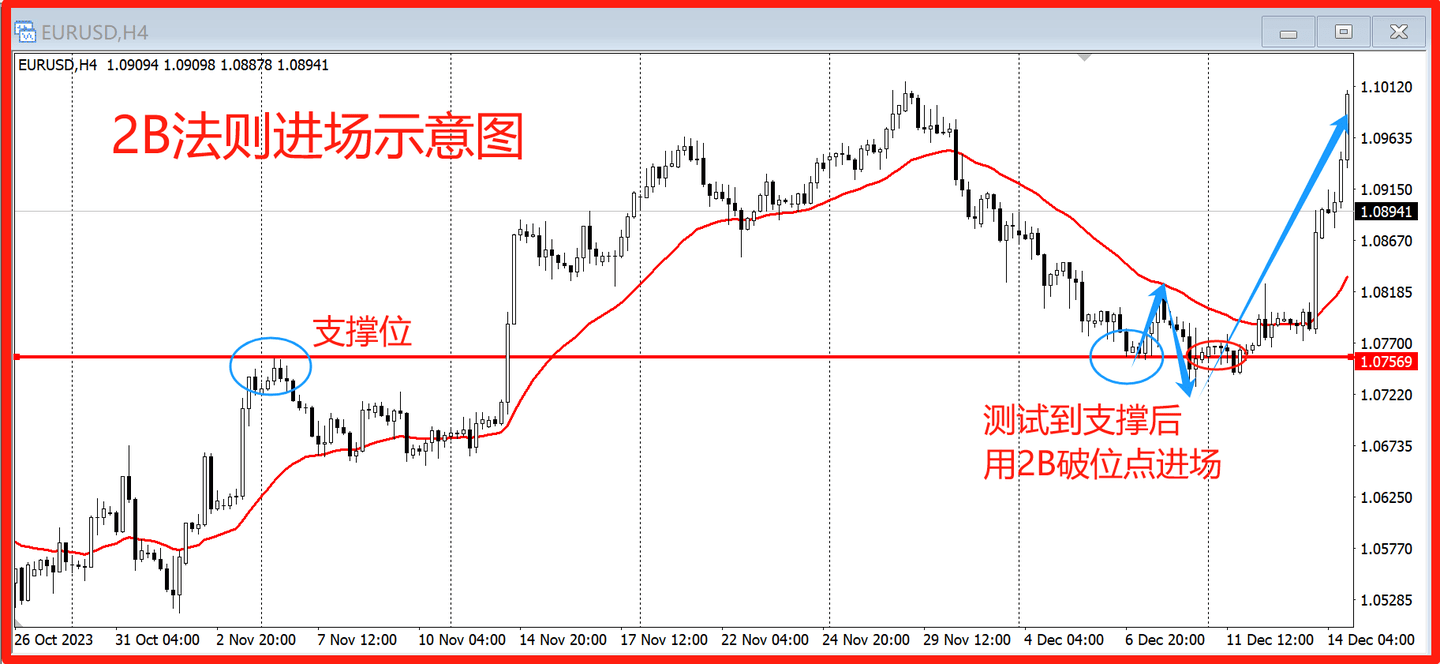 The chart shows the 4-hour candlestick chart of EUR/USD.
After the market retreated from 1.10100 to test level support at 1.07500, it stabilized and pulled back upwards. The market then quickly broke down to create a new low, then returned to form a 2B pattern. Entering the market at the 2B breakout point, the opening price was 1.07500, and the stop loss was set at the previous low of 1.07200, with a stop loss of only 300 small points. The market then rose significantly by 2600 small points, achieving a very ideal risk-reward ratio.
Notes on the use of the 2B rule:
(1) The 2B rule should only be used after a continuous strong bullish or bearish trend has formed a reversal expectation.
(2) During the process of breaking down from point B to point C, strong bullish or bearish candles can enhance the effects of inducing short and inducing long, resulting in a higher probability of reversal.
(3) Using the 2B rule's patterns in conjunction with important support and resistance levels yields better results.
3. Double rule
The double rule is a rule of market trends, stating that after a breakout, the running space is at least twice that of the previous consolidation pattern, or it refers to a price range with support or resistance that is twice the space.
For example, patterns such as rectangular consolidations, double tops and bottoms, head and shoulders tops and bottoms, etc., all possess such characteristics.
Let me explain with an image.
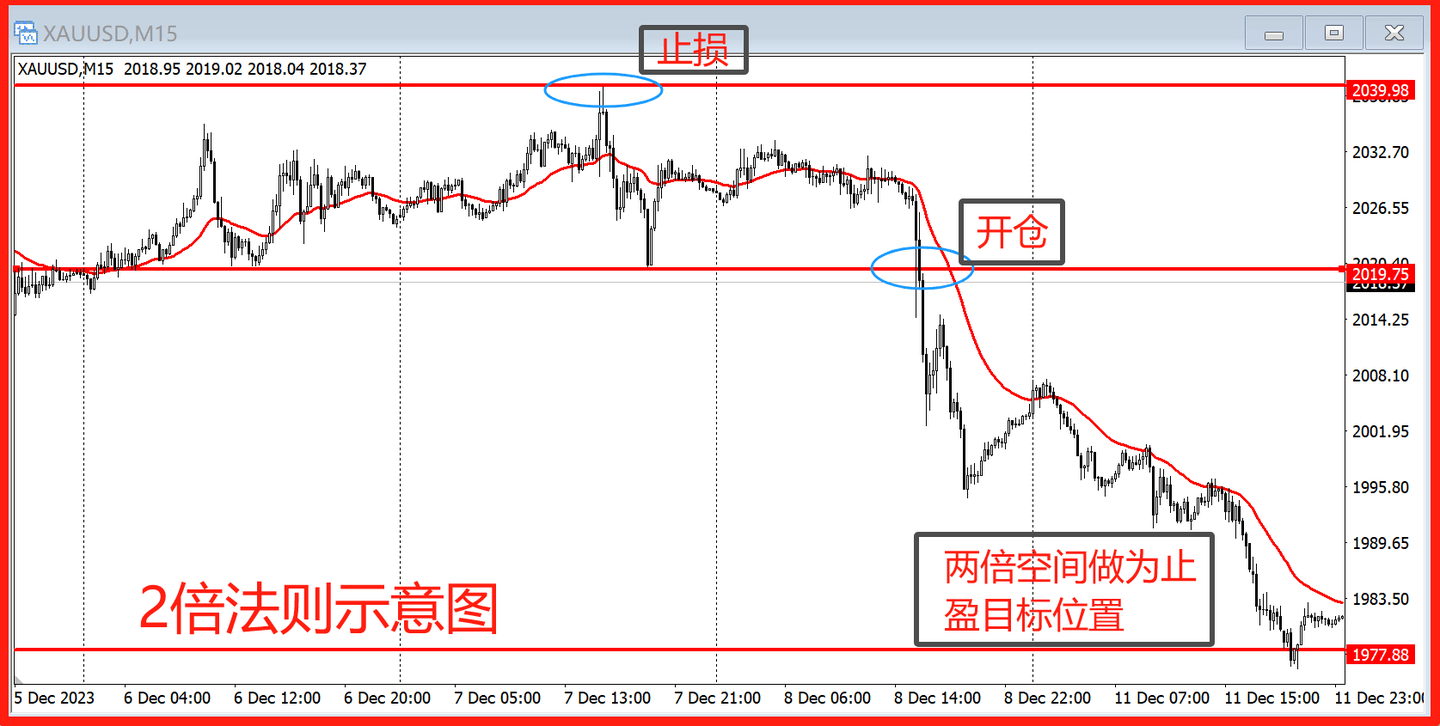 The chart shows the 15-minute candlestick chart of spot gold, where the market is consolidating at the top, forming a head-and-shoulders top pattern.
After the market breaks out of the consolidation pattern, short positions can be entered. The opening price is 2019, and the stop loss is set at 2039, with a stop loss space of $20. After the breakout, the market declines, and when the decline reaches around $40, the market starts to stabilize and fluctuate.
In practice, consider setting the take profit target near this area, or when the market reaches this level, move the stop loss for protection or partially close positions to lock in profits.
Notes on the use of the double rule:
(1) The space of the double rule is the most basic profit space after the breakout, which can be used as a relatively conservative profit target. However, in fast-moving markets or significant trend movements, the space may exceed double.
(2) The double space rule uses the high and low points of the consolidation range for stop loss, which can achieve at least a 2:1 risk-reward ratio. If, in practice, next-high or next-low point stop loss is used, or smaller timeframe entry stop loss is applied, the stop loss space is small. When the market reaches double the space, the risk-reward ratio is already very good.
For example, in the breakout point of the 15-minute chart in the above image, if the stop loss is set at the breakout turning point of the 5-minute chart, the stop loss can be reduced by half, resulting in a stop loss of $10. When the market reaches twice the amount, the risk-reward ratio can be achieved at 4:1, which is already very ideal.
4. Two-thirds rule
The two-thirds rule is a timing rule. When the market reaches the 2/3 position of the time cycle, the probability of breakout is relatively high, or the success rate of breakout at the 2/3 position of the time cycle is also high.
This rule is mainly applied in triangular consolidation patterns. The probability of breakout at the 2/3 position of the triangular cycle is relatively high. After breaking out at the 2/3 position, the probability of genuine breakout is also high.
Let me explain with an image.
 The chart shows the 1-hour candlestick chart of gold. Recently, after gold reached a historical high point of 2144, the market quickly pulled back, forming a triangular consolidation pattern. From the starting point to the endpoint of the triangle, there are a total of 134 candlesticks (marked by the red rectangle in the chart). The market broke out at the 90th candlestick (marked by the blue rectangle in the chart), at about 2/3 of the position, and then continued to fall.
According to the 2/3 rule, when trading in triangular consolidations, pay special attention to the 2/3 time node and focus on trading the breakout pattern at the 2/3 position to improve trading success rates.
5. Sensitivity and effectiveness of indicator parameters
Many traders in trading are puzzled by the parameters of indicators because a parameter may perform very well in one phase but later lead to losses, causing confusion over how to select indicator parameters.
The confusion arises from not understanding the sensitivity and effectiveness rules of indicator parameters.
Sensitivity and effectiveness rules of indicators: small parameters have good sensitivity but poor effectiveness, while large parameters have poor sensitivity but good effectiveness.
Taking moving averages as an example, small parameters, like the 10-day moving average, change quickly, are very sensitive to trends, and can timely signal market reversals, allowing for earlier entries, but they also have many false signals.
In contrast, large parameters, like the 30-moving average, change slowly, signaling market reversals later, allowing for later entries with fewer false signals.
Let me explain with an image.
 The chart shows the 15-minute candlestick chart of spot gold, with two moving averages: the red one is the 30-moving average, and the black one is the 10-moving average.
In the chart, you can see that the 10-moving average is very sensitive. During the downtrend, there are multiple candlesticks standing above the moving average that indicate reversal signals, which is not beneficial for holding positions. The 30-moving average has consistently followed the bearish trend without showing reversal signals, indicating better stability in this segment of the trend.
However, when the market reaches the bottom and is about to reverse, the 10-moving average can signal an exit earlier, while the 30-moving average signals later, showing the advantage of the 10-moving average's sensitivity.
Other indicators, such as Bollinger Bands, MACD, etc., have similar characteristics for both small and large parameters.
There are no indicator parameters that perform well in all market conditions. When choosing a parameter, one must accept its imperfections. Along with the profits it brings, one must also accept the potential losses when it does not align with the market.
When choosing indicator parameters, consider which one is more suitable for yourself. A person with a quick temper who requires high trading frequency should choose small parameters; if they want to hold positions for a longer period, they should choose large parameters.
Understanding the sensitivity and effectiveness rules of indicator parameters, it is sufficient to choose a balance point that meets your psychological expectations between sensitivity and effectiveness.
6. Time and space equivalence principle
There is a saying in trading that goes: time for space.
There is a common general rule in market trends: the longer the consolidation period, the higher the probability of success after the breakout, and the larger the space available for movement after the breakout. This is the principle of time-space equivalence, also known as 'the longer the horizontal, the deeper the vertical.'
Let me explain with an image.
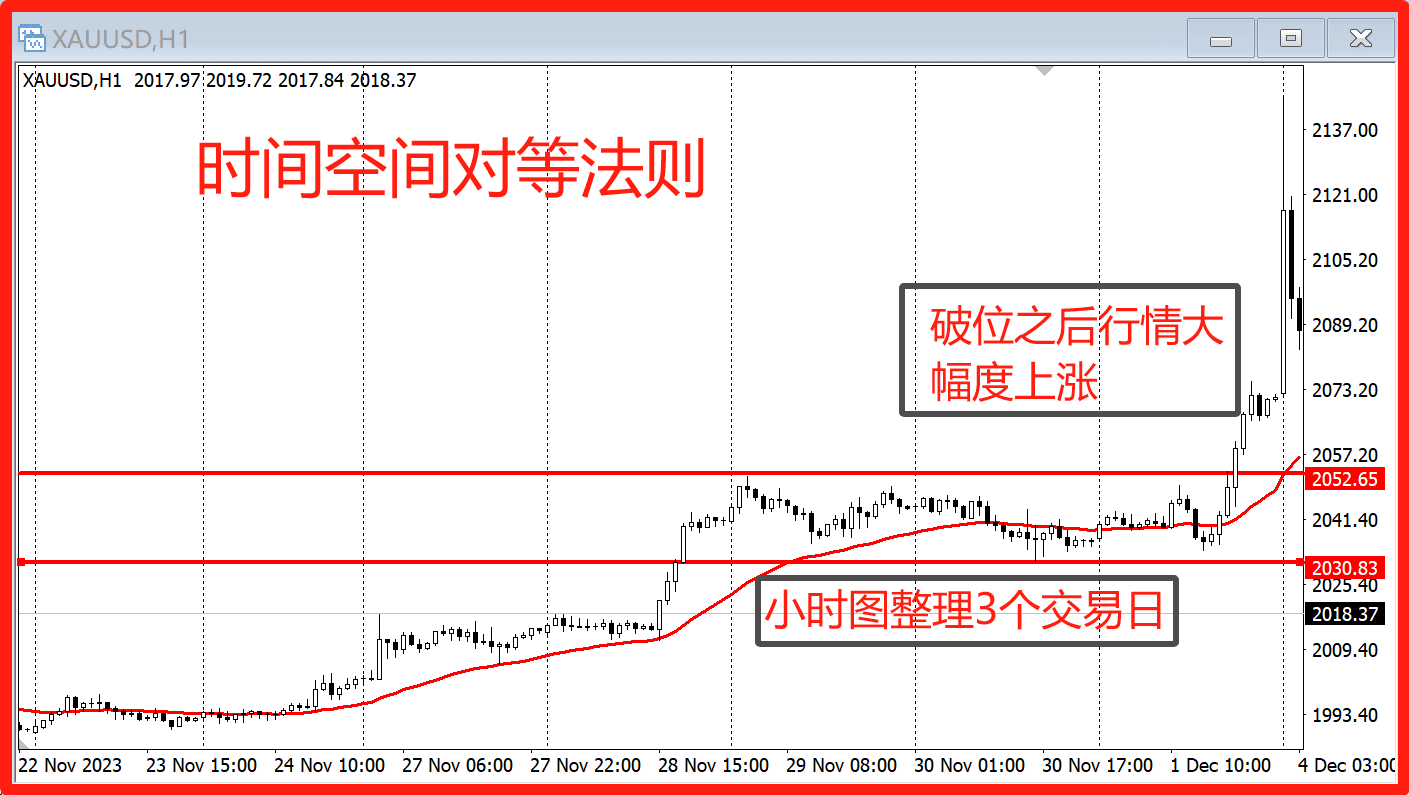 The chart shows the 1-hour candlestick chart of gold. After a continuous rise, a rectangular consolidation structure is formed, lasting three trading days, with the consolidation range being very compact.
After long periods of consolidation, the market rises sharply after breaking out, and gold also took advantage of this consolidation pattern to reach a historical new high.
Notes:
(1) Long-term consolidation patterns formed near important key positions should be given special attention, as they often accumulate strong power. Once the market breaks out, it is a high-probability, high-profit quality trading opportunity.
(2) Patterns with long consolidation periods and small spaces of consolidation, like the patterns in the above example, are also quality trading opportunities.
The above content consists of very basic yet important rules in technical analysis. Understanding and utilizing these rules will make our trading more precise and improve success rates.
I am Little Egg Tart, a professional analyst and educator, a mentor and friend on your investment journey! As an analyst, the most basic thing is to help everyone make money. I solve confusion and problems, speaking with strength. When you feel lost and don't know what to do, follow Little Egg Tart; Little Egg Tart will guide you.#加密市场观察 $ETH

