
The price of Solana started a new round of increase above $135. Currently, the SOL price is consolidating above $142 and may further rise above $145.
The SOL price against the US dollar has started a new round of increase, breaking through the $135 and $140 levels.
The current price is above $140 and also above the 100-hour simple moving average.
On the hourly chart of the SOL/USD currency pair, an ascending trend line is forming, with support at $143 (data source: Kraken).
If the resistance level of $145 is broken, the currency pair may continue to rise.
Solana price is rising strongly
Solana's price began to rise steadily after stabilizing above $128, similar to the trends of Bitcoin and Ethereum. The SOL price climbed above $135, entering a short-term upward range.
The price even broke through the resistance level of $140. Bulls successfully pushed the price above $142. Currently, the price is consolidating above the 23.6% Fibonacci retracement level of the recent rally from the low of $123 to the high of $146.
Solana is currently trading above $140 and is above the 100-hour simple moving average. Additionally, an upward trend line is forming on the SOL/USD hourly chart, with support around $143.
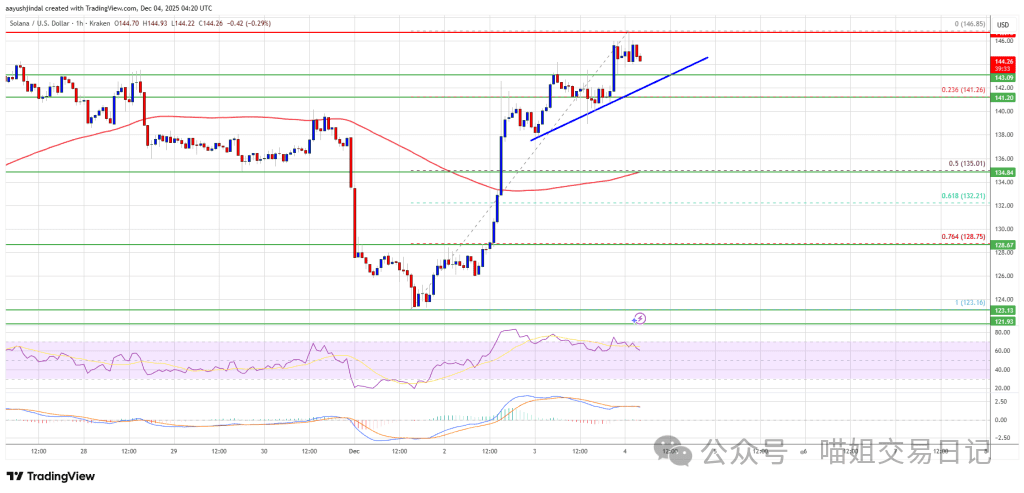
The good news is that the price faces resistance around $145. The next major resistance level is around $148. The main resistance level may be at $150. If it successfully closes above the resistance area of $150, it may lay the foundation for the next round of steady growth. The next key resistance level is $162. Any further rise could push the price towards $180.
Is SOL retracing again?
If SOL fails to break through the resistance level of $145, it may begin a new round of declines. The initial support level on the downside is around $143, close to the trend line. The first major support level is around $135, which is also the 50% Fibonacci retracement level of the recent rally from the low of $123 to the high of $146.
If it falls below the $135 level, the price may decline to the support area around $128. If the closing price falls below the support level of $128, the price may further drop to around the support level of $120 in the short term.
Technical indicators
Hourly MACD indicator - The MACD of SOL/USD is slowing in the rising zone.
Hourly RSI (Relative Strength Index) - The RSI of SOL/USD is above the 50 level.
Major support levels - $143 and $135.
Major resistance levels - $145 and $150.


