
Bitcoin has surprised investors with its resilience in recent days. Despite rising U.S. inflation, continued outflows from spot Bitcoin ETFs, and escalating geopolitical tensions between the United States and Iran, the world's largest cryptocurrency managed to gain more than 2% over the past 24 hours.
According to analysts at CryptoQuant, however, a much more important story may be unfolding beneath the surface. Several on-chain indicators suggest that Bitcoin could be approaching a major structural bottom in the current market cycle.
CryptoQuant: A Historic Bottom May Be Closer Than Many Expect
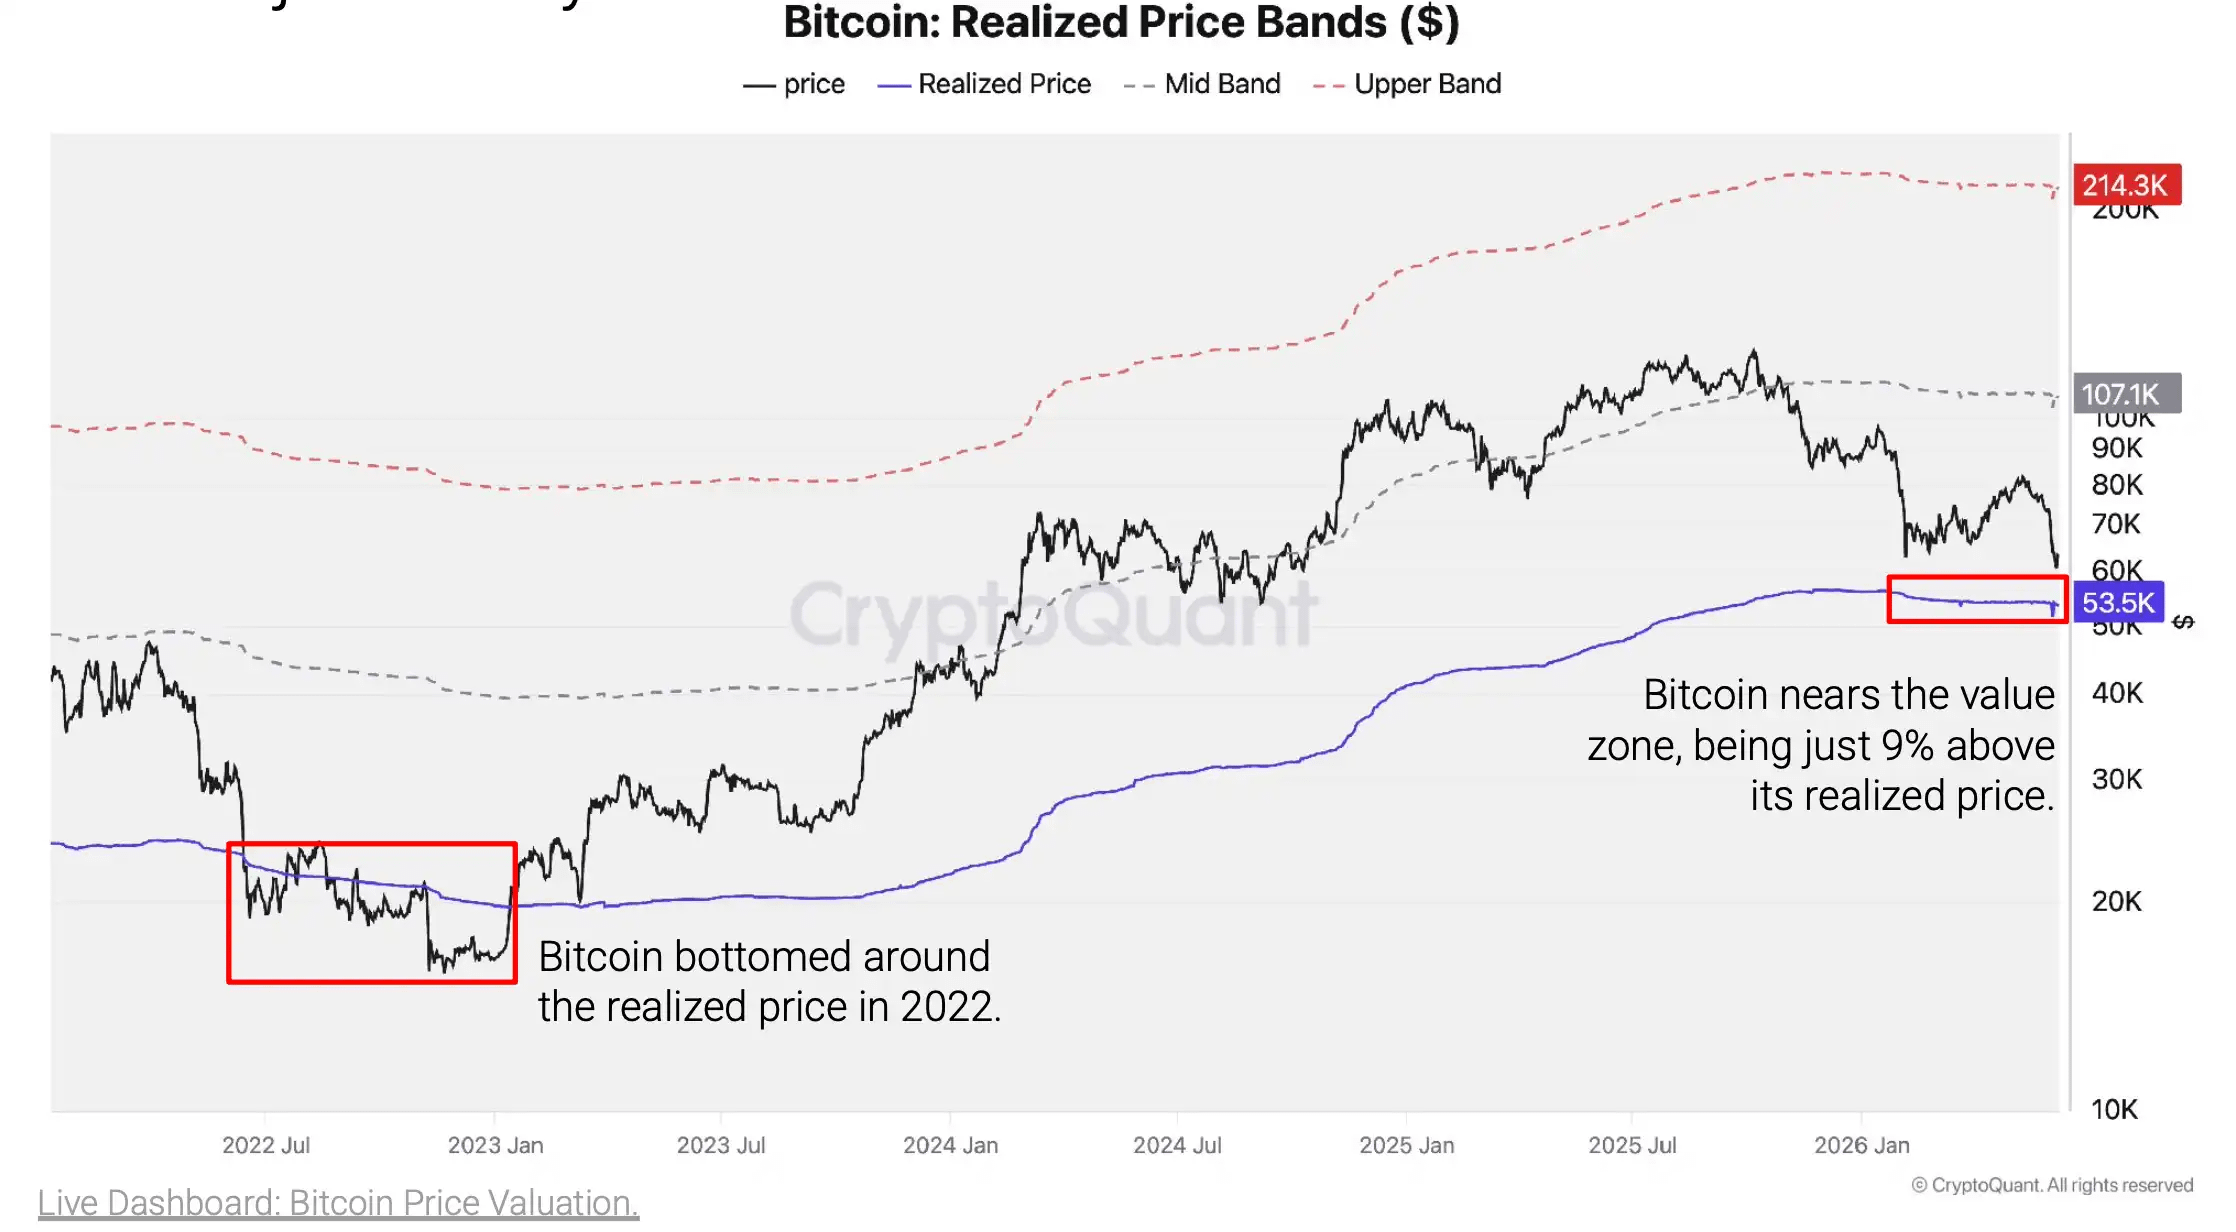
CryptoQuant Head of Research Julio Moreno noted that Bitcoin has historically found market bottoms near its realized price.
This metric represents the average price at which all existing bitcoins were last moved on-chain and is widely regarded as one of the most important indicators of Bitcoin’s long-term value.
In the current cycle, Bitcoin’s realized price sits near $53,600.
“Historically, this level has often confirmed market bottoms. That doesn’t necessarily mean we’ve reached one yet, but considering the weak demand for Bitcoin, it remains a possibility,” Moreno explained.
Last week, BTC fell to roughly $59,000, placing it only about 9% above its realized price. Since then, the market has recovered part of its losses, pushing Bitcoin back above $62,000.
Price Alone Is Not Enough
Although Bitcoin is trading near levels that have historically marked major bottoms, analysts caution that key confirmation signals are still missing.
According to CryptoQuant, a sustainable recovery would require a meaningful rebound in demand, stabilization of capital flows, and stronger investor participation.
Moreno emphasized that without a recovery in demand, the current market conditions cannot yet be considered a definitive end to the correction.
For now, the area should be viewed as a potential bottom zone rather than confirmation of a new bull market.
ETFs and Institutions Remain a Headwind
Weakening institutional demand continues to weigh on the market.
Spot Bitcoin ETFs have experienced capital outflows in recent weeks, while many large investors have adopted a more cautious stance toward risk assets.
Glassnode also highlighted that Bitcoin’s recent drop below $60,000 coincided with rising losses among short-term holders.
Many newer investors sold their positions at a loss, increasing downward pressure on the market.
At the same time, options markets have begun pricing in greater uncertainty and elevated risk expectations.
The Four-Year Cycle Still Points Toward Recovery
Well-known market analyst Benjamin Cowen remains optimistic.
According to Cowen, Bitcoin’s traditional four-year cycle continues to follow a pattern similar to previous market cycles.
He believes the final bottom could emerge around October, while acknowledging that another move below $60,000 cannot be ruled out.
Persistent macroeconomic challenges, elevated interest rates, and uncertainty surrounding central bank policy remain the primary concerns.
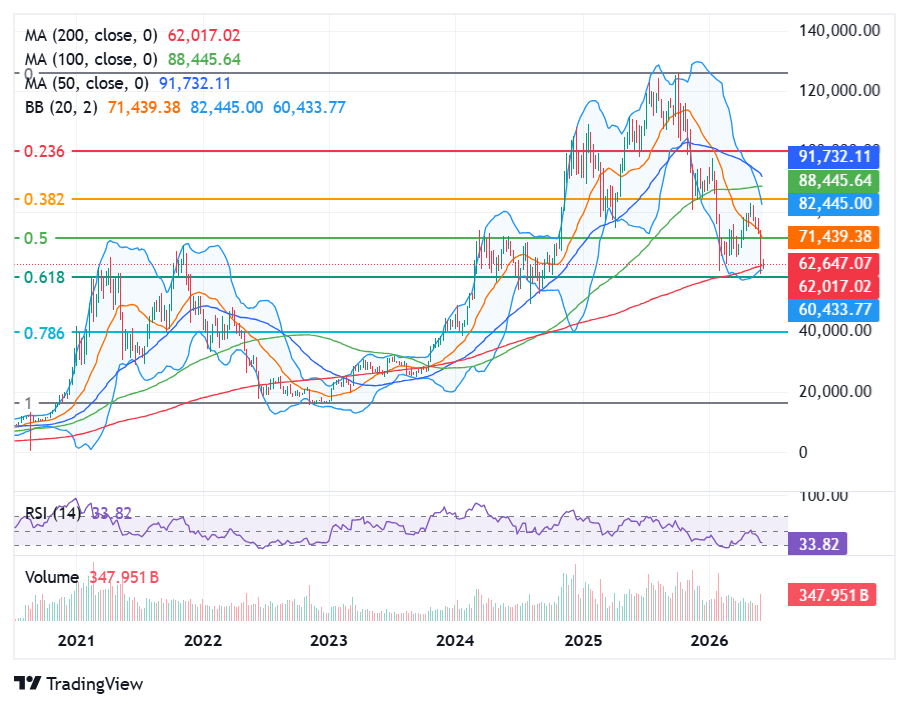
Nevertheless, Cowen notes that Bitcoin is currently reacting to one of its most important long-term technical indicators—the 200-week moving average—which has repeatedly served as strong support throughout previous cycles.
Technical Indicators Suggest a Possible Reversal
Some traders are also pointing to the potential formation of a double-bottom pattern.
Bitcoin has repeatedly tested the area around $60,000, where significant buying activity continues to emerge.
Another bullish signal comes from the fact that BTC is trading within the Fibonacci Golden Zone on the weekly chart. Historically, this region has often been associated with major long-term trend reversals.
The combination of the Fibonacci Golden Zone and the 200-week moving average has led some analysts to believe that Bitcoin could eventually target $70,000 again if market conditions stabilize.
Derivatives Markets Are Beginning to Bet on a Recovery
Optimism is also becoming visible in the futures market.
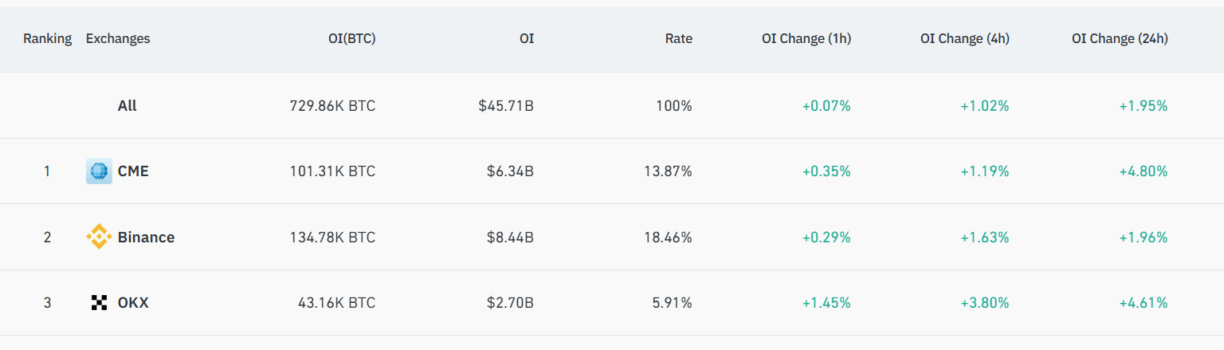
Data from CoinGlass shows that Bitcoin futures open interest increased by nearly 2% over the past 24 hours, reaching approximately $45.71 billion.
The strongest increases were recorded on CME, Binance, and OKX, where open interest rose by roughly 5%, 2%, and 4%, respectively.
Such activity often signals growing trader participation and an increased willingness to open new positions.
While short-term uncertainty remains elevated, rising futures activity suggests that a portion of market participants is beginning to position for a stronger recovery in the months ahead.
A Defining Moment for Bitcoin
Bitcoin now finds itself in one of the most important zones of the current market cycle.
On one side stand weakening demand, ETF outflows, and persistent macroeconomic risks. On the other are historically significant technical levels, growing futures market activity, and on-chain signals that have often preceded major bottoms in the past.
The question now is whether Bitcoin is preparing for the next major bull cycle—or whether investors still face one final wave of volatility before a lasting trend reversal takes shape.
#BTC , #bitcoin , #CryptoNews , #CryptoAnalysis , #etf
Stay one step ahead – follow our profile and stay informed about everything important in the world of cryptocurrencies.
Disclaimer:
The information and opinions presented in this article are for informational and educational purposes only and should not be considered financial or investment advice. Nothing on this page constitutes a recommendation to buy or sell any assets. Cryptocurrency investments are inherently risky and may result in financial loss. Always do your own research before making any investment decisions.