Is Dogecoin welcoming a reversal signal? The descending wedge may indicate a 96% upside potential.
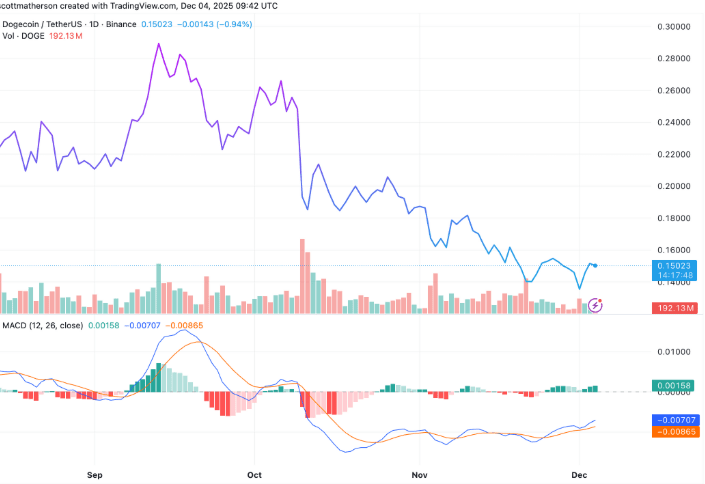
Over the past 30 days, Dogecoin has been slowly declining for most of the time, with lower lows and lower highs. Although the trend is compact, it also presents a predictable rhythm. While the overall downward trend is evident, technical analysis shows that some key trends may be quietly forming, leading the market to start paying attention to potential rebounds in the future. #加密市场观察
Initial appearance of the descending wedge: buyers quietly gaining strength
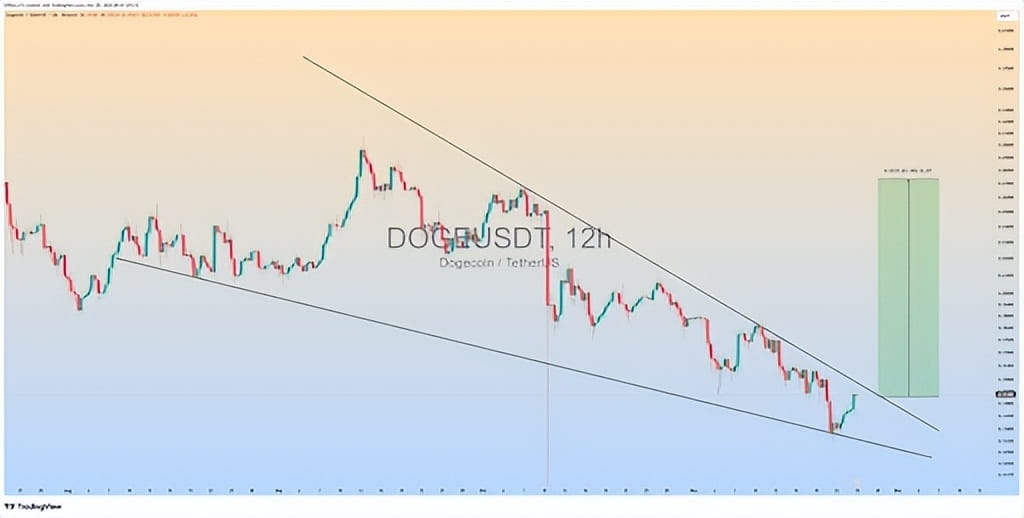
New analysis shared by cryptocurrency commentator Clifton Fx indicates that Dogecoin is forming a descending wedge structure. This pattern appears in a downtrend, with two downward-sloping trend lines gradually converging, and the price oscillates in a winding manner, with each rebound becoming smaller and the distance between the trend lines narrowing.
A key feature of the descending wedge is that as the pattern tightens, sellers gradually lose control, and buyers begin to quietly gain the upper hand. This means that once the buying power is sufficient, the price may undergo a significant breakout, reversing the short-term downward trend.
Price approaching the upper boundary: momentum turning signal
Clifton Fx's analysis also shows that Dogecoin is currently approaching the upper boundary of the wedge pattern. In the past 48 hours, Dogecoin has slightly rebounded from a low of $0.135, with multiple 12-hour green candlesticks appearing consecutively, bringing the price closer to the upper resistance line.
Technically, if Dogecoin can produce a strong breakout candlestick, it means that the descending wedge is completed, and buying momentum begins to dominate the market, with the price expected to enter a sustained upward phase. Conversely, if the breakout strength is insufficient, the price may fall back again, testing the support trend line below, with the current support level approximately at the mid-point of $0.13.
Upside potential: 96% reason
The descending wedge not only suggests that the trend may reverse but also helps analyze the potential magnitude after the breakout. According to technical analysis, the vertical height crossed by the wedge pattern can be used to estimate the upward movement after the breakout. Clifton Fx's chart shows that if Dogecoin successfully breaks through the upper boundary, the price is expected to rise approximately 96% from the current level.
Of course, this does not mean that the price will skyrocket immediately. The market still needs transaction volume to accompany the breakout, ensuring that buyers truly have control. Any insufficient breakout strength or lack of trading volume could lead to the price being blocked at the resistance line and sliding back down to the support line below.
Short-term outlook: cautiously optimistic
Dogecoin has been under pressure for several weeks, but the appearance of the descending wedge brings a glimmer of hope to the market. In the short term, if buyer strength continues to increase and breaks through the upper boundary of the wedge, the price may experience a significant rebound, potentially reaching an upside of 96%.
However, the market is still full of variables. If there is insufficient trading volume and momentum, the breakout may fail, and the risk of price retreating still exists. Investors need to be cautious in positioning while paying attention to rebound opportunities, reasonably controlling positions to avoid blindly chasing highs.
Conclusion
The descending wedge provides a reversal signal for Dogecoin, but a short-term rise still requires momentum and trading volume. For retail investors, focusing on the key resistance level breakout situation, maintaining patience and caution is the best strategy to seize opportunities.


