
For more than a decade, on-chain metrics have been among the most trusted tools for measuring investor behavior and overall market sentiment in the cryptocurrency industry. Active addresses, transaction volumes, and exchange flows have often helped analysts identify market tops, bottoms, and trend reversals.
But the landscape has changed dramatically.
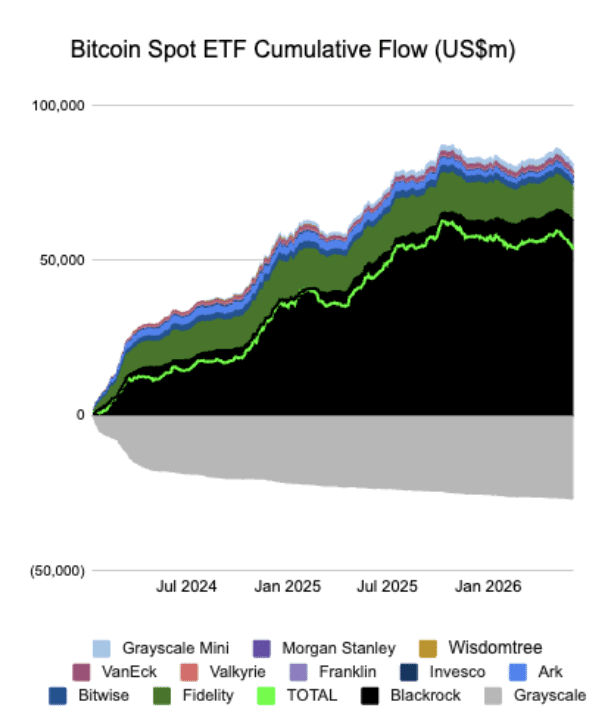
The launch of U.S. spot Bitcoin ETFs introduced a new way for investors to gain exposure to Bitcoin without ever interacting directly with the blockchain. As a result, billions of dollars can now enter the market with little impact on traditional on-chain indicators.
This has raised an increasingly important question: Are the metrics that guided crypto investors for years still telling the full story?
ETFs Have Changed How Investors Buy Bitcoin
When spot Bitcoin ETFs launched in January 2024, analysts expected significant institutional inflows—and that prediction proved correct.
What changed, however, was the route that capital takes into the market.
Today, investors can buy Bitcoin exposure through a standard brokerage account without setting up a crypto wallet, managing private keys, or interacting with blockchain networks.
As a result, substantial capital inflows can drive Bitcoin prices higher without generating corresponding increases in active addresses or transaction activity.
This phenomenon became especially visible during Bitcoin’s rally above $70,000. While prices reached new highs, many traditional blockchain metrics remained well below the levels seen during previous bull markets.
Ethereum Faces a Similar Challenge
A comparable transformation is taking place within the Ethereum ecosystem.
In the past, monitoring activity on Ethereum’s main blockchain provided a relatively accurate picture of network usage.
That is no longer the case.
A growing share of activity has migrated to Layer 2 networks such as Arbitrum, Optimism, Base, and zkSync. These solutions bundle thousands of transactions together before settling them on Ethereum’s main chain, significantly reducing fees and congestion.
At first glance, this can make Ethereum’s on-chain activity appear weaker.
In reality, users have simply moved to faster and more efficient scaling solutions.
Analysts who focus exclusively on Layer 1 data risk underestimating the true level of activity across the broader Ethereum ecosystem.
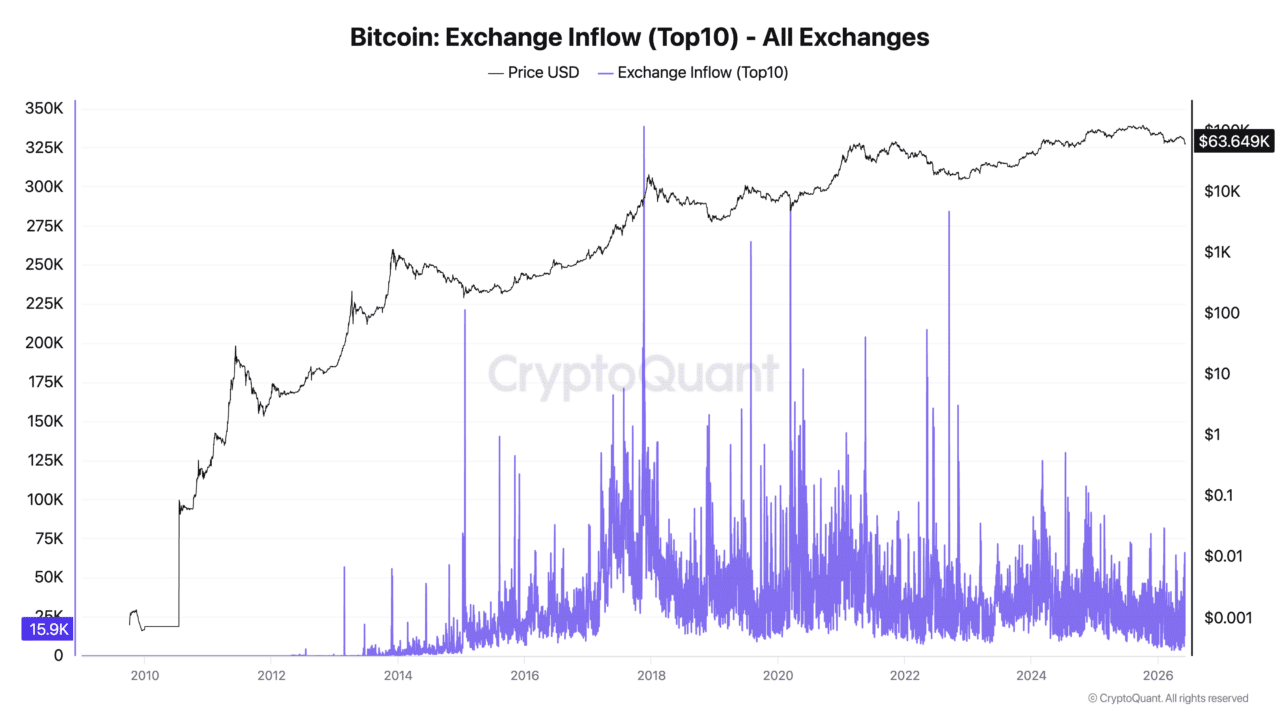
Do Exchange Inflows Still Signal Selling Pressure?
Another traditional market indicator undergoing a transformation is exchange flow data.
For years, large inflows of cryptocurrency to centralized exchanges were viewed as a bearish signal because investors often transferred assets to exchanges when preparing to sell.
Today, that interpretation is becoming less reliable.
Institutional investors, hedge funds, and asset managers increasingly use exchanges for custody services, derivatives hedging, portfolio rebalancing, and liquidity management.
As a result, coins moving onto exchanges do not necessarily indicate imminent selling pressure.
In many cases, such transfers may simply reflect operational or strategic portfolio decisions rather than a bearish market outlook.
Traditional Metrics Aren’t Wrong—They’re Incomplete
Industry experts emphasize that conventional on-chain indicators have not become useless.
The challenge is that many of these metrics were developed during an era dominated by retail investors, self-custody, and direct blockchain interaction.
Today’s market is shaped by ETFs, institutional capital, custodians, and Layer 2 ecosystems.
This means the same data points may carry very different implications than they did several years ago.
What Analysts Are Watching Now
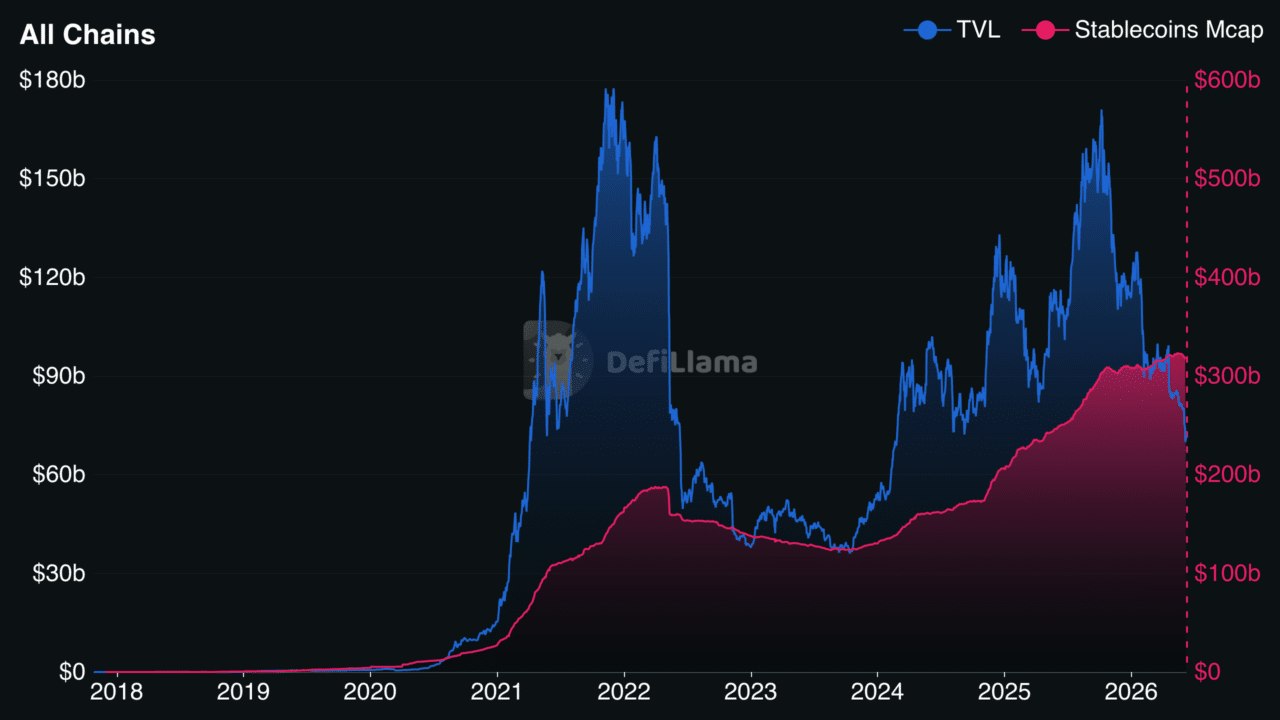
As the crypto market evolves, analysts are increasingly turning to additional indicators.
One of the most important is Total Value Locked (TVL), which measures how much capital is actively being used within decentralized applications and protocols.
A rising TVL often signals stronger user engagement, increasing liquidity, and growing confidence in a blockchain ecosystem.
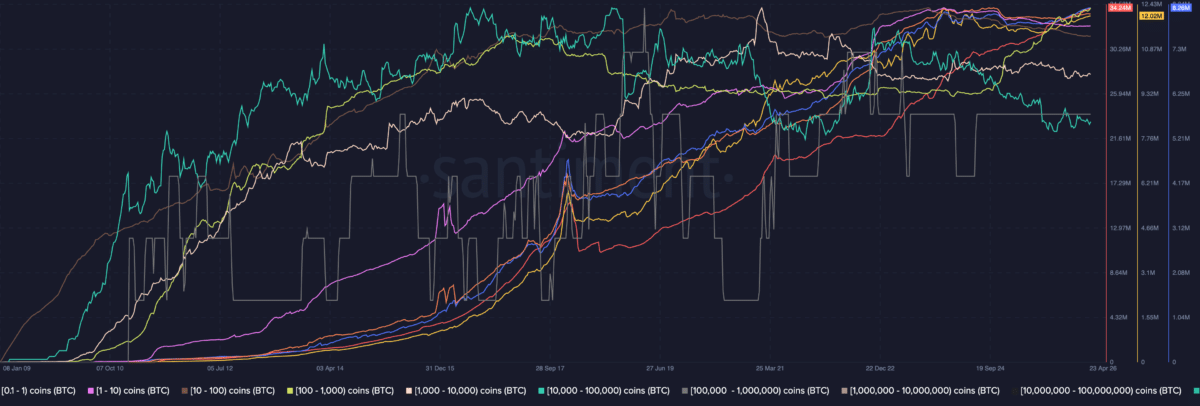
Market participants are also paying closer attention to whale activity.
Large holders frequently move ahead of broader market trends, making whale transactions valuable early indicators of shifting sentiment.
Stablecoin metrics have become another critical tool. By monitoring stablecoin supply, exchange balances, and market dominance, analysts can better assess whether capital is entering the crypto market, remaining on the sidelines, or rotating into riskier assets.
The Era of the Single Indicator Is Over
The cryptocurrency market of 2026 looks very different from the market of five or ten years ago.
ETFs, institutional participation, and the rapid growth of Layer 2 networks have fundamentally changed how investors interact with digital assets.
As a result, relying on a single metric is no longer enough to understand market sentiment.
Modern crypto analysis increasingly combines on-chain data, ETF flows, stablecoin liquidity, whale activity, and derivatives market information.
According to many industry observers, connecting these different data points is now essential for understanding where the cryptocurrency market is truly heading.
#bitcoin , #etf , #BTC , #CryptoMarket , #blockchain
Stay one step ahead – follow our profile and stay informed about everything important in the world of cryptocurrencies.
Disclaimer:
The information and opinions presented in this article are for informational and educational purposes only and should not be considered financial or investment advice. Nothing on this page constitutes a recommendation to buy or sell any assets. Cryptocurrency investments are inherently risky and may result in financial loss. Always do your own research before making any investment decisions.