
Bitcoin is moving into a zone historically associated with bottom formation, but the on-chain structure still points to capitulation, not confirmation.
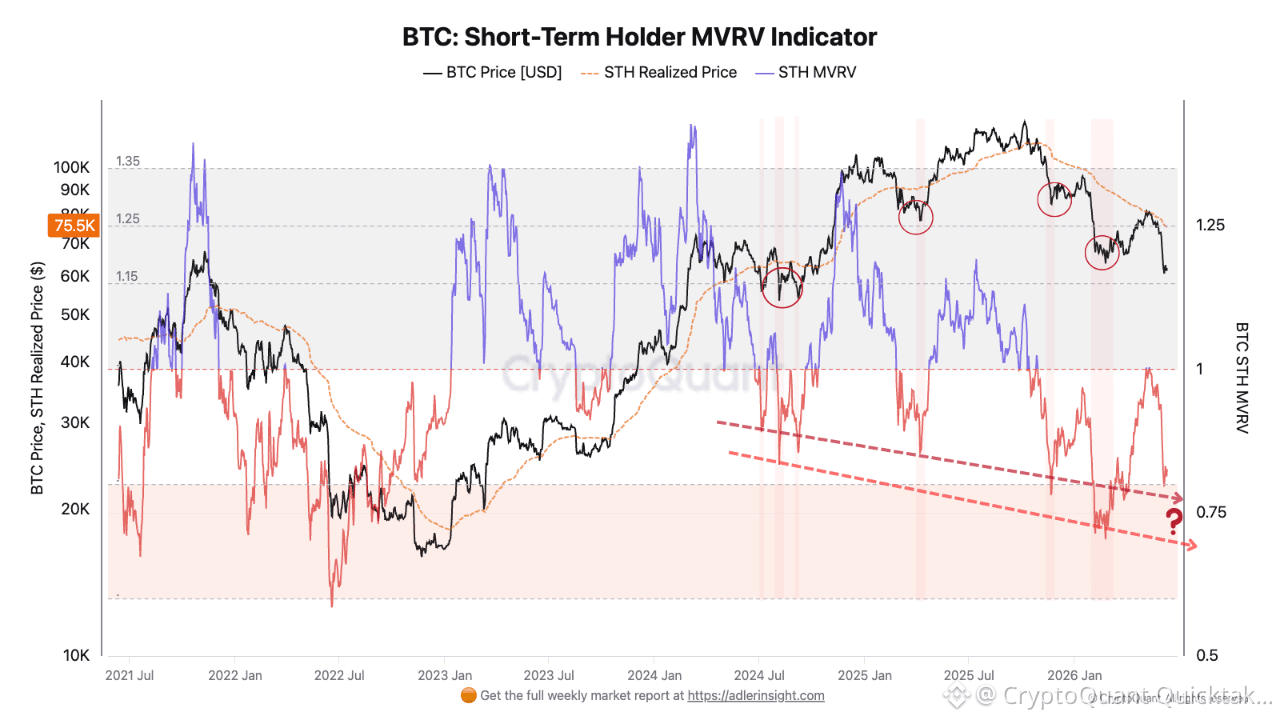
STH MVRV measures recent buyers' market value against their aggregate cost basis. At 1.0 they break even; the metric has now bled toward the 0.75–0.80 zone, meaning the average coin bought in recent months sits at a loss.
Historically this band is where weak hands are flushed and durable floors form, every prior tag preceded a local bottom. The caveat is each rally since 2024 has printed a lower MVRV high and low (descending channel), so demand momentum is fading even as the metric reaches oversold.
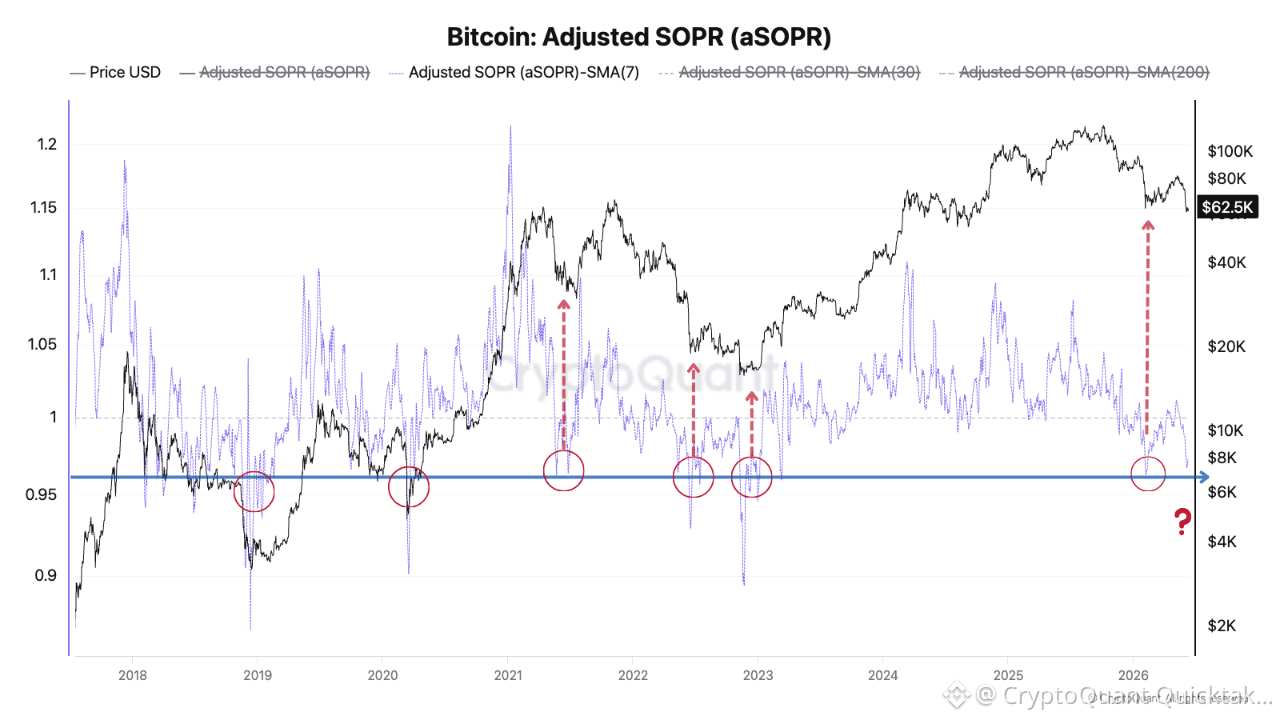
aSOPR confirms the behaviour. It tracks whether spent coins move at a profit (>1.0) or a loss (<1.0). The 7-day SMA is pressing the ~0.96 support that has marked every major seller-exhaustion event since 2019. Below 1.0, holders are realizing losses, selling into pain, precisely the condition that precedes reversals once the selling base is spent.
The signal completes only on double confirmation: aSOPR (7D SMA) reclaiming and holding above 1.0 for several sessions, and STH MVRV turning back through 1.0 toward its realized price.
A price bounce alone is necessary but insufficient, without both metrics flipping, this stays an oversold market, not a regime change.
Written by MorenoDV_