The alarm has sounded again! Just now, the one-hour K-line chart of Dogecoin, that glaring bearish candle, ruthlessly broke through the key support of $0.1487. It seems small, but the dark currents behind it are enough to make all holders' scalps tingle. I am Lingxi, and today, I must lay out the cruel truth in plain language for you.
Is the news all just a 'smoke screen'? Institutions are playing a dangerous game.
The message says 'active addresses surge', 'ETF application submitted', a scene of prosperity. But why is the price falling? The sell order details in the chart do not lie—over 400 million units of institutional selling pressure every hour, like a cold machine, crushing all positive fantasies. This is reminiscent of a classic scene in a movie: while announcing good news with drums and gongs, quietly transporting treasures out the back door. The hope that retail investors see may just be the 'chips' being distributed by the main force. So, is their intention to smash the market really to give up completely? Or is there a deeper conspiracy? Keep watching.
The technical chart has drawn out the 'ghost gate', 0.143 is the last face.
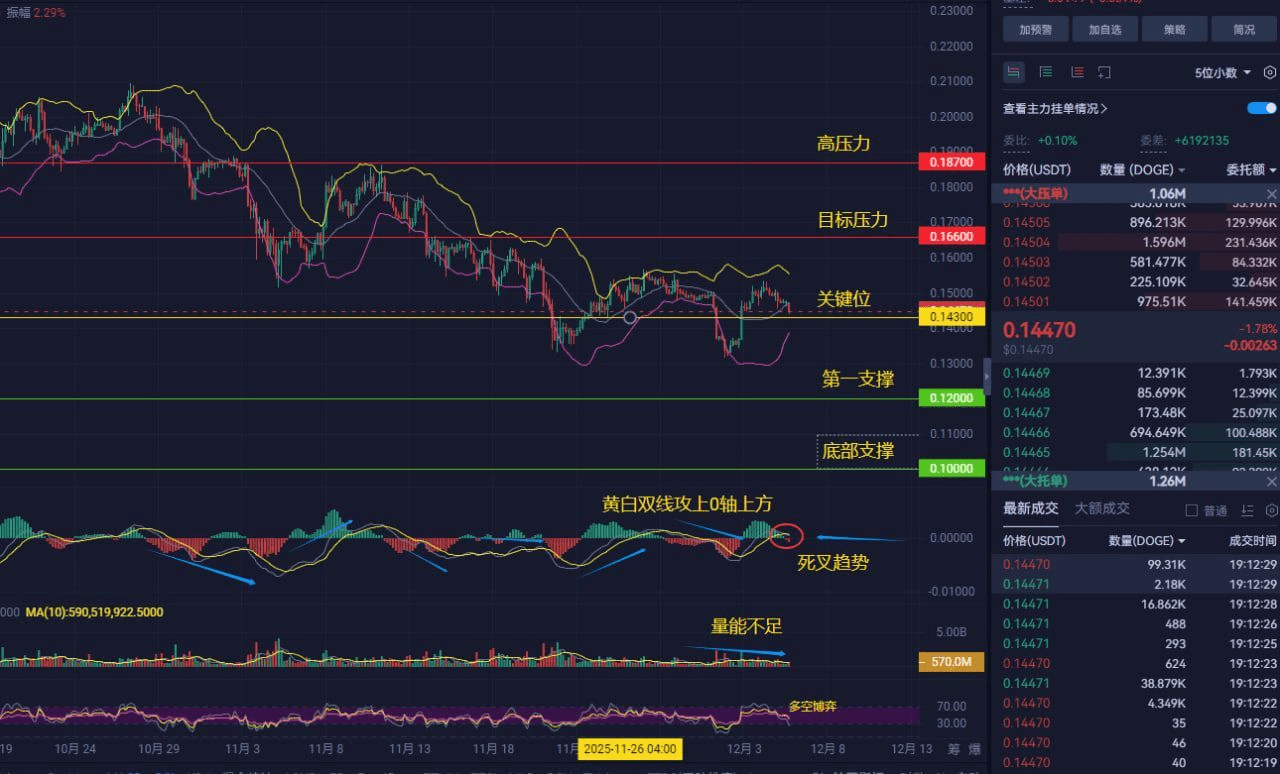
Let's look at this 4-hour K-line chart before us. Above 0.166-0.187, I have marked it as a 'high-pressure zone', where countless brothers who chased up previously are trapped. Every rebound near there will trigger desperate selling. And below, the line at 0.143 has been marked as a 'key level', this is the Maginot line for the bulls, once lost, the military morale will completely collapse. More critically, the MACD, although barely standing above the zero line, has already 'crossed dead', it's like when your heart rate starts to alarm while running, but you still want to sprint. Therefore, my core view is very clear: I am bearish and believe that any rebound towards 0.166 is an excellent exit opportunity, not an entry signal.
The script for the market has been written: How should retail investors 'survive in the cracks'?
There are only two ways to go from here, but for you and me as retail investors, the outcome points to the same operation. Script one (probability 70%): The price will repeatedly hover above 0.143, even creating a rebound to 0.155-0.16, making everyone think a double bottom has formed and a bull market is returning. This is exactly what I referred to earlier as a 'conspiracy', the aim is to attract the last wave of bottom fishing, then a big bearish candle will smash through 0.143. Script two (probability 30%): A direct decline without any rebound, breaking through 0.143. Once 0.143 is confirmed to be broken, the next target is the 0.12 drawn in the picture, or even the abyss at 0.1.
It has just begun. Click to follow and join, I will inform you at the first moment whether to run or charge forward.
The market is always fluctuating, but logic and data do not lie. Follow Lingxi, join in, and I will give you the clearest signal at the key points when the market starts. We not only want to survive the fluctuations but also accurately seize the next wave of major upward momentum!#比特币VS代币化黄金 $DOGE