Key points
Current price: $89,300 (as of December 6, 10:00 AM)
24-hour decline: -3.27%
24-hour high: $92,650
24-hour low: $88,421
Short-term outlook: bearish consolidation, but there is a chance for an oversold rebound
The price continues to stay below key moving averages, and the technical outlook appears weak
The 1-hour and daily MACD show divergence signals, suggesting a potential rebound
RSI is approaching the oversold zone (1-hour 35.47, 4-hour 37.86), indicating possible technical recovery in the short term
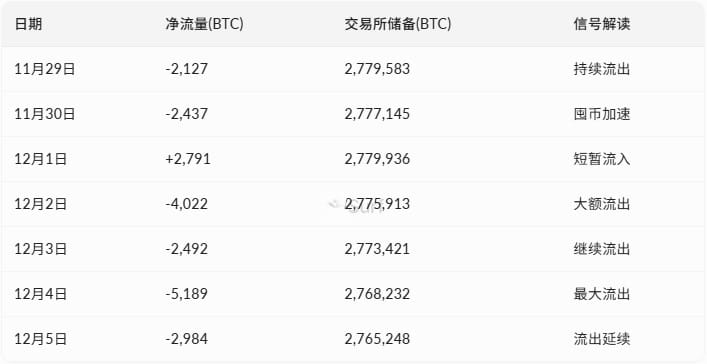
On-chain data shows continued net outflow (-2,984 BTC), and the sentiment to hold coins supports the bottom
Key support:
First support: $88,874 (intense liquidation area for bulls)
Second support: $88,502 (Accumulated long liquidation level)
Third support: $87,987 (1-hour lower Bollinger band)
Key resistance:
First resistance: $89,525 (Short liquidation starting point)
Second resistance: $90,000 (Maximum pain point for short-term options)
Third resistance: $91,000 (Maximum pain point for cycle options)
Technical analysis
Multi-timeframe technical indicators

Key price structure
Support level system:
Core support: $88,500-$88,874 range is a dense liquidation zone for longs, historically strong support effect
Technical support: $87,987 (1-hour lower Bollinger band) and $89,342 (4-hour lower Bollinger band) form a short-term defense line
Deep support: $84,447 (daily lower Bollinger band) is the target for extreme pullbacks
Resistance level system:
Recent resistance: $89,525 short liquidation starting point, breaking through may trigger a chain reaction
Medium-term resistance: $90,000-$91,000 is the key area for maximum pain points of options, crucial positions for institutional games
Moving average resistance: EMA12 ($90,442-$90,875) forms a compression zone
Derivative market signals
Futures position data:
Total open contracts: $57.22 billion, down 3.91% in 24 hours
Leverage has cooled significantly, market entering a deleveraging phase
Funding rate differentiation: Binance 0.00657% (longs pay), Bybit -0.003487% (shorts pay)
Options market characteristics:
Total open contracts: $51.29 billion, down 3.67% in 24 hours
Recent expiration contracts' maximum pain points are concentrated at $90,000-$91,000
Market makers tend to suppress prices at pain point levels to maximize profits
On-chain data insights
Exchange liquidity changes
Whale and retail behavior
Whale movement:
On December 4-5, single-day outflow exceeded 33,000 BTC, showing large holders withdrawing coins to self-custody
On December 1, after a peak inflow of 47,930 BTC, it quickly reversed, suspected short-term selling pressure release
Hodler patterns:
6 out of 7 days net outflow, hoarding sentiment dominates
Exchange circulating supply continues to decline, reducing potential selling pressure
Reserve USD value fluctuates between $24 billion and $25.9 billion, price adjustments did not trigger panic selling
Market sentiment and public opinion
Mainstream narrative on social media
Short-term cautious faction:
The community questions the recent price drop without obvious negative news, attributing it to coordinated liquidation operations
Technical analysts warn that bear flag tests lower support, short-term volatility risks are increasing
Policy events (interest rate decision) approaching are seen as volatility catalysts
Long-term optimists:
Institutional adoption milestones (state-level reserves, mainstream company recommendations) are believed to bring continuous capital inflow
Historical pullbacks are framed as normal phenomena within bull market cycles, often signaling a prelude to upward movement
Famous hodlers (like Michael Saylor) continue to advocate for a strategy of holding through cycles
Key opinion leader viewpoints
Technical faction (Rekt Capital):
Emphasizing that the degree of resistance level rejection is weakening, support zone is strengthening, may break through the consolidation range
Questioning the integrity of the cycle but maintaining objectivity, without emotional bias
Macro faction (Mister Crypto):
Believing that despite favorable economic data, panic sentiment is still fermenting
Expecting macro liquidity changes and a decline in Bitcoin's dominance will trigger a relief rebound
Fundamental faction (Vijay Boyapati):
Firm long-term belief, viewing current FUD as a precursor to bottoming
Emphasizing the transformative significance of institutional platform adoption on the adoption curve
24-48 hour outlook
Scenario analysis
Bearish scenario (probability 60%):
Trigger condition: Drop below $89,342 (4-hour lower Bollinger band)
Target: Test $88,500 support cluster, in extreme cases probe down to $87,987
Driving factors: 4-hour MACD negative divergence continues, derivative positions decrease, short-term selling pressure not fully released
Bullish scenario (probability 40%):
Trigger condition: Hold above $89,525 and break through $90,000 resistance
Target: Rebound to the $90,000-$91,000 options pain point range
Driving factors: 1-hour/daily MACD divergence realization, on-chain net outflow supports the bottom, RSI oversold correction
Key observation indicators
Short-term bull-bear dividing line:
$89,342: 4-hour lower Bollinger band, if lost, will accelerate downward exploration
$89,525: Short liquidation starting point, recovery will trigger a rebound
Volume matching:
Current 24-hour transaction: $49.89 billion, need to break through $90,000 with volume to confirm reversal
If it drops below $88,500 with low volume, it will continue to weaken
Risks and opportunities
Main risks:
Decline in derivative positions suggests momentum exhaustion, lack of funding to push up
Social sentiment differentiation, market manipulation narratives weaken retail confidence
The gap between SMA50 ($99,499) and SMA200 ($109,267) is large, technical pressure is heavy
Potential opportunity:
On-chain hoarding signals are clear, supply-side contraction is a long-term benefit
Oversold indicators combined with MACD divergence, technical rebound window opens
The maximum pain point for options is at $90,000-$91,000, institutions have the motivation to push prices toward this range
Operational advice
Aggressive strategy:
Attempting to bottom in the $88,500-$88,874 support range, with stop loss set below $87,900
Target looking at $90,000-$91,000, risk-reward ratio about 2:1
Conservative strategy:
Wait for the price to recover above $90,000 and stabilize before going long, confirm reversal signals
Or wait for a drop below $88,500 to position near $87,987, aiming for a deep rebound
Defensive strategy:
Hodlers can continue to hold, on-chain data supports long-term allocation logic
Short-term traders are mainly waiting for a clearer direction before re-entering
