according to the materials of the site - By ETHNews

Polkadot is showing the first signs of a potential market reversal after a deep retest of the support level. Analysts are currently examining whether the asset has entered the 'spring' phase of Wyckoff - one of the strongest bullish signals in accumulation cycles.
The technical situation noted by Bitcoinsensus occurred when DOT demonstrated renewed intraday volatility and a sharp bounce from recent lows.
The price chart shows a decisive breakout closer to the beginning of December when DOT sharply fell before buyers stepped in around the $2.00 zone. The sharp recovery wick observed on the TradingView chart is characteristic of the 'Wyckoff spring' pattern—a phenomenon where the price drops below the support level, triggering stop-losses and flushing weak holders.
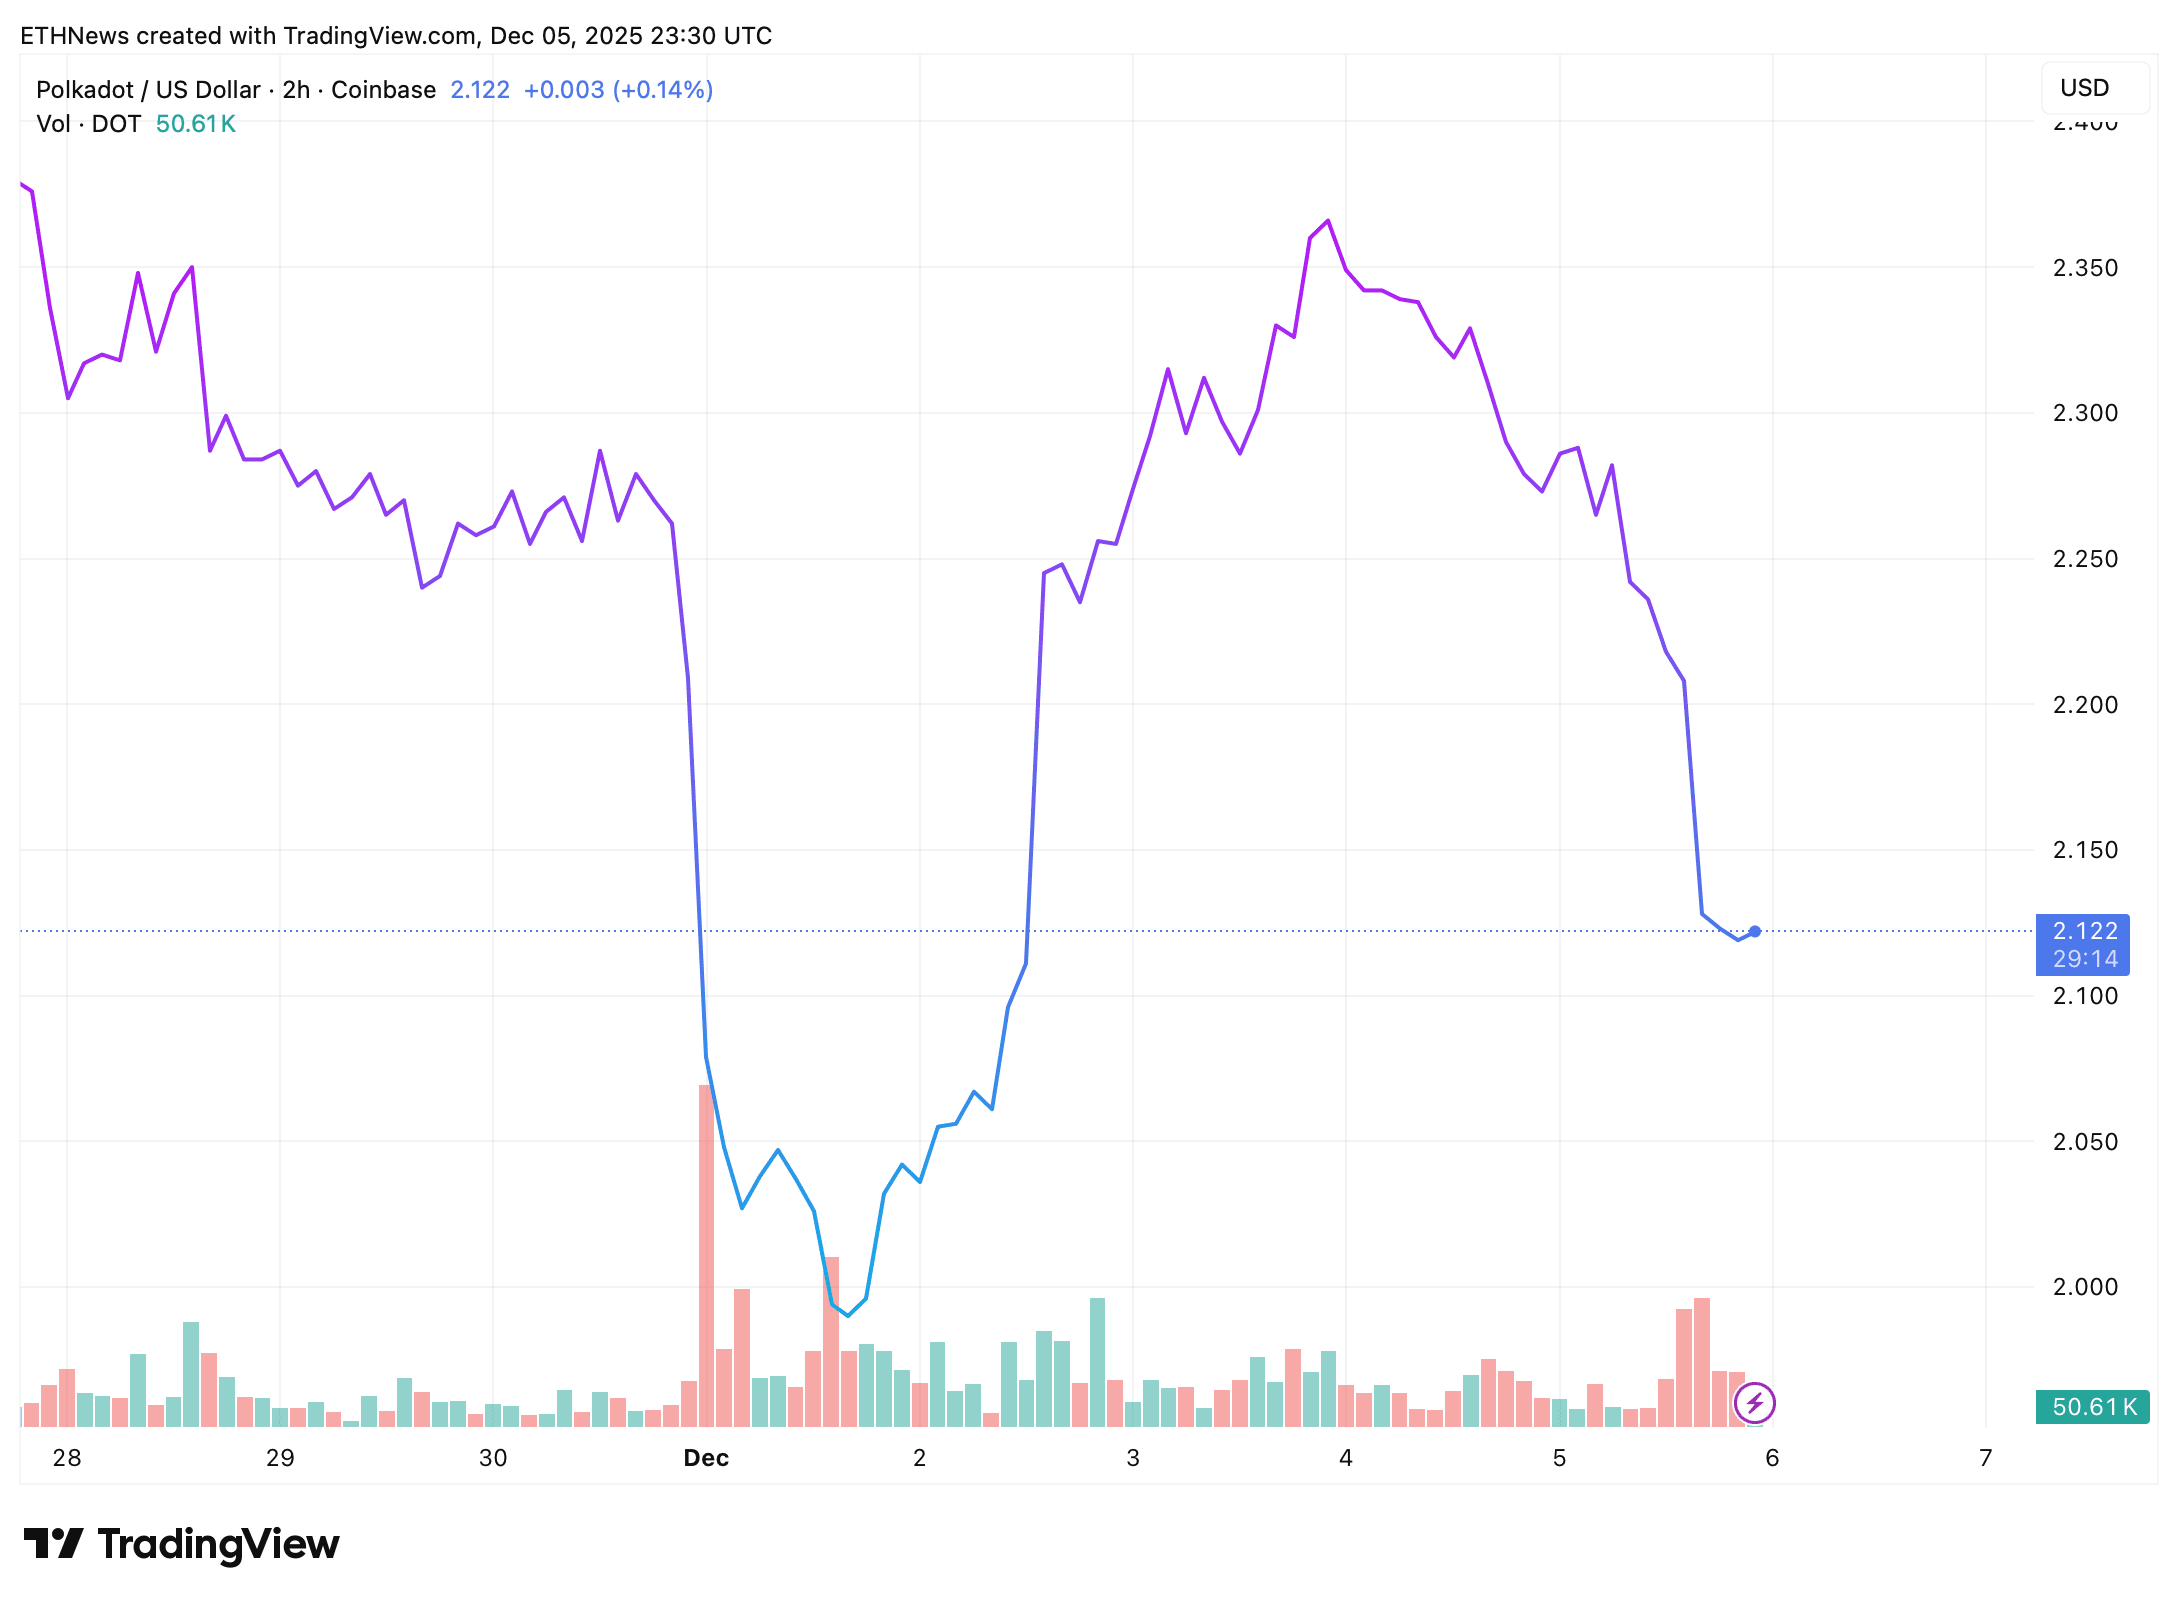
After the bounce, the price of DOT returned to $2.30 before facing a rebound, rolling back to $2.12 at the time of charting. This pattern reflects the market's attempt to stabilize after several months of a downtrend.
Bitcoinsensus notes that the accumulation structure of DOT has been forming since 2023, and the current deep test of support aligns with the criteria of the Wyckoff spring. In classic Wyckoff theory, the spring is the last spike before a significant trend reversal. The analyst notes:
Deep test of support, corresponding to spring behavior;
Multi-year accumulation range;
Potential upcoming signal of strength (SOS), if the price breaks resistance;
Target breakout level: $12–$15, representing significant growth potential from current levels.

The chart provided by Bitcoinsensus describes a typical Wyckoff structure:
SC (Selling Climax): initial breakout on high volume
ST (Secondary Test): retesting that confirms strong support
AR (Automatic Rally): the first significant bounce
Spring: the final liquidation move, where DOT may currently be located
LPS (Last Point of Support): higher lows confirming market demand
SOS (Sign of Strength): breakout of resistance
If DOT follows this classic structure, the next key event will be sustained growth above average resistance, opening the way to higher levels.
Despite the bullish setup, the current DOT/USDT chart shows choppy movement: sharp rises are followed by equally rapid sell-offs. The volume remains modest, indicating that more strong confidence is still needed for a full trend reversal. DOT fluctuates around $2.12, holding above recent lows, but not yet showing a clear breakout.
Until DOT can regain key resistance levels, the Wyckoff spring will remain just a possibility rather than a confirmed trend change.
$BTC , $XRP , $BNB
#Сryptomarketnews , #MarketRebound
Those who do not enjoy a large volume of news usually do not bother subscribing to our channel... 🙄 And those who do not want to waste time searching for news on their own can find everything here, already consolidated into one news feed!!!