Waking up in the morning, I took a look at the one-hour chart of ETH, and wow, it really got me energized—after the MACD death cross, it turned into a golden cross again! But now the price is still falling, is this really a smoke screen put out by the big players, or a signal for a trend change? Don't rush, let me analyze it for you.
First, let's talk about the capital flow. The Ethereum Foundation transferred out 1,000 ETH, worth about 3.12 million dollars, which easily makes people think the authorities are reducing their holdings, and the short-term market sentiment is definitely bearish.
However, BlackRock's ETHA has seen a net inflow of $222.9 million for two consecutive weeks, with large funds quietly bottoming out ETH, which is completely opposite to the outflow of funds from Bitcoin. In addition, BlackRock has also deposited a lot of BTC and ETH into Coinbase, which is likely for market making or arbitrage operations, and doesn't necessarily indicate a bearish outlook.
Looking at the one-hour chart, the overall trend of ETH is indeed downward, and the current price is still being pressured below $3130. However, taking a closer look at the MACD indicator, the white line and yellow line have turned from a death cross to a golden cross below the zero axis. From a technical perspective, this is a signal for a short-term rebound, but don't be too optimistic, as this is occurring below the zero axis, and the rebound strength may not be very strong.
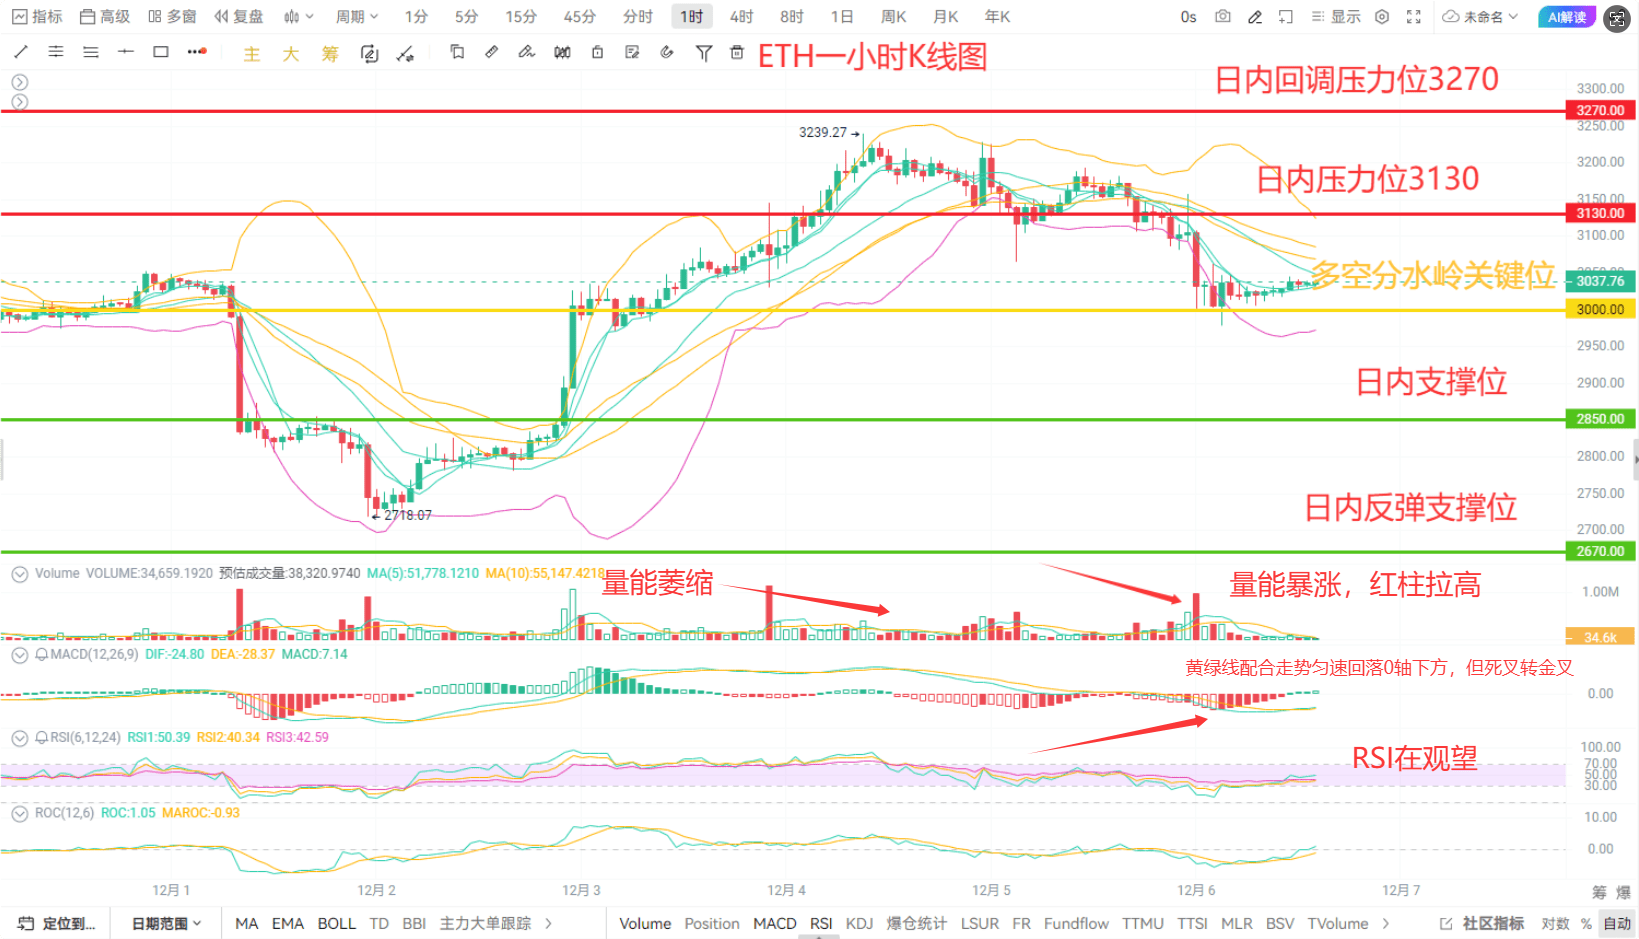
I will clarify the key price levels for everyone. The upper resistance levels are $3130, the intraday pressure; and $3270, the retracement pressure. The lower support level, $3000 is the dividing line for bulls and bears, $2850 is the intraday support, and $2670 is the strong support for rebounds.
To put it simply, if ETH can break through $3130, the price might try $3270; if it falls below $3000, it could drop to $2850, or even $2670.
Big Mao thinks that ETH is very likely to rebound first today and then face pressure. The MACD golden cross will drive the price up a bit to test $3130; if the trading volume does not keep up, the price is likely to be pushed down again in the range of $3130 - $3270. The real strong support is around $2670. If this downtrend continues, that will be the strong support for this phase.
Big Mao's strength is not boastful, not just empty promises; he teaches you practical money-making skills. Follow Big Mao, if you want to keep up with his fans @大毛淘金 . Big Mao publishes entry and exit points every day in the chat room! #比特币VS代币化黄金 #美联储重启降息步伐 #美国结束政府停摆


