This analysis is based on the 1 hour (1H) chart of the pair $POWER /USDT, and the data shows significant volatility in the last 24 hours.
1. Key Data of Price and Volume (24h):
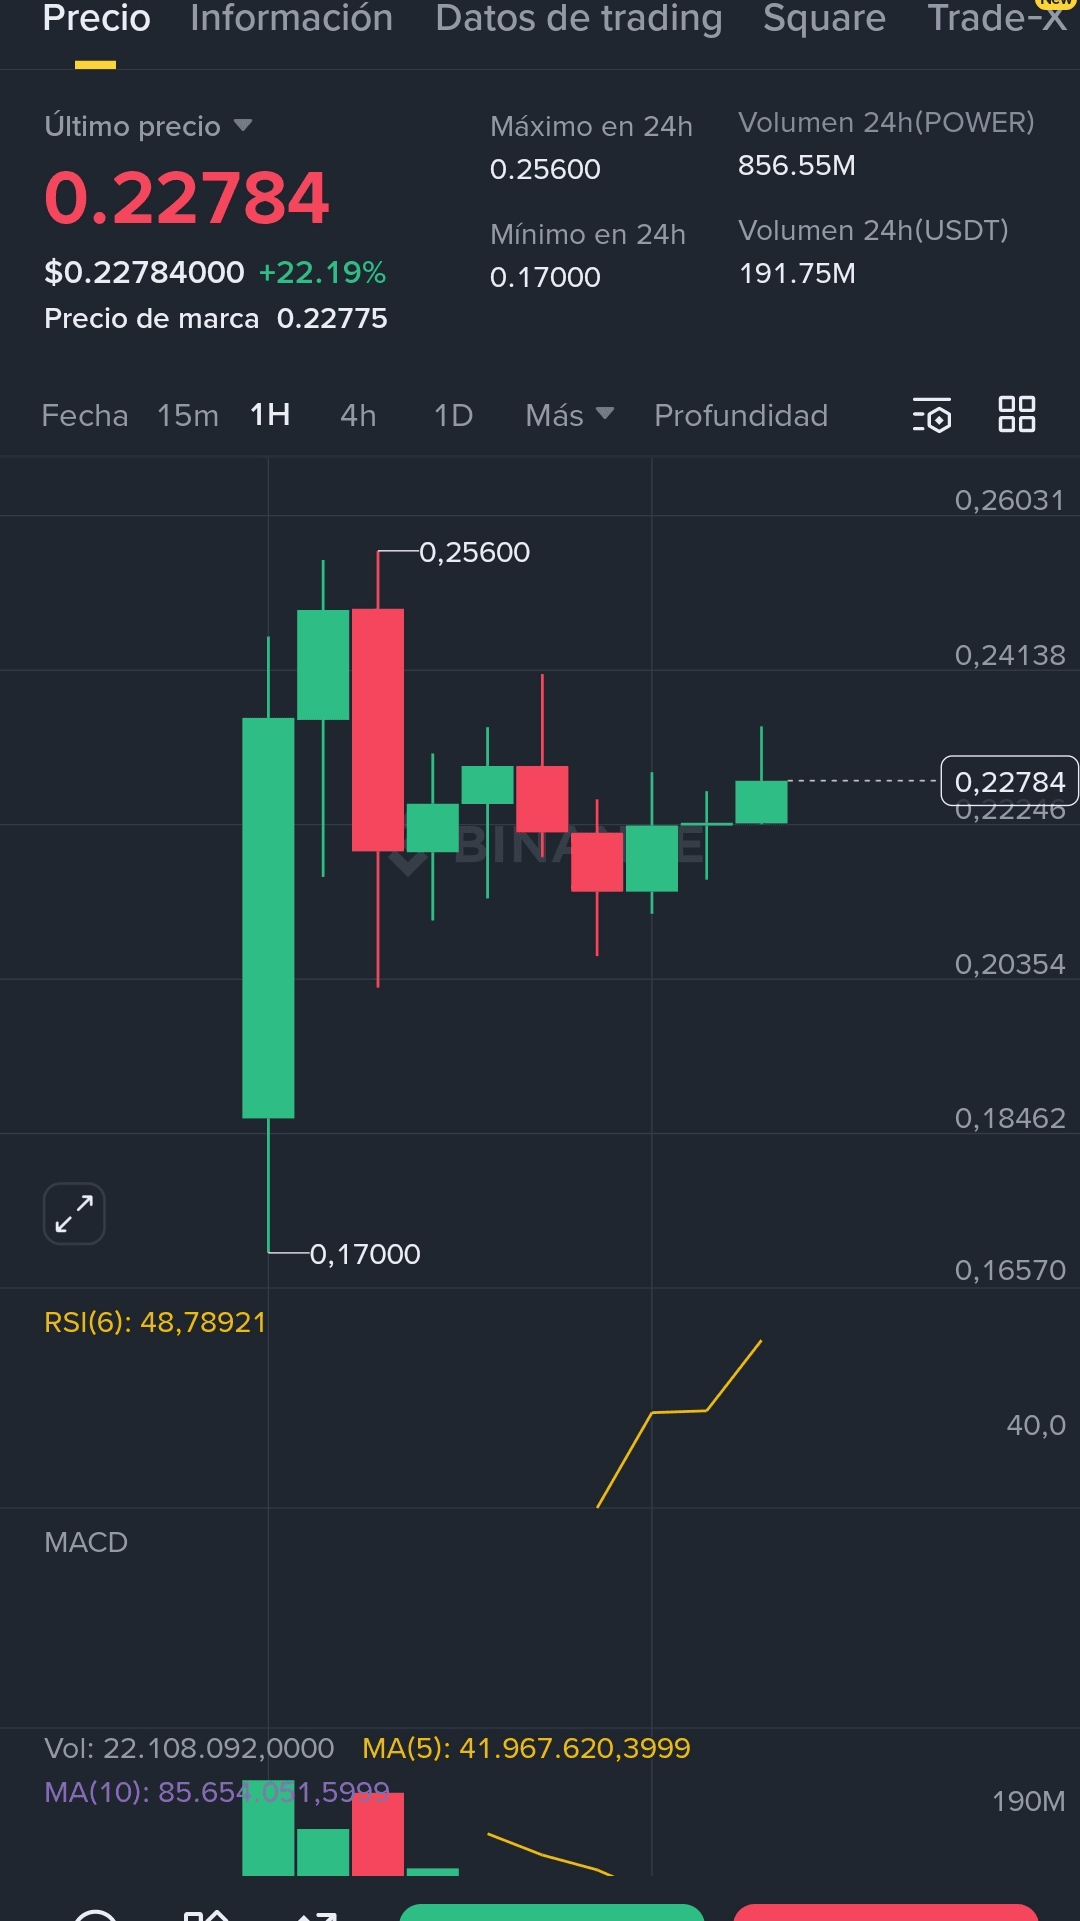
Current Price (Last Price): $0.22784
24h Change: The pair has experienced a strong movement, with an increase of +22.19% in the last day.
24h Range:
Maximum (Max in 24h): $0.25600
Minimum (Min in 24h): $0.17000
Volume (24h): The high volume confirms interest.
Volume in POWER: 856.55M
Volume in USDT: 191.75M
2. Chart Analysis (Price Action):
Price Structure: The 1-hour chart shows a strong lower wick that touched the low of $0.17000, followed by a rapid recovery. $POWER
Trend: After the strong initial movement (from $0.17000 to $0.25600), the current price action appears to be consolidating sideways. The price remains above the key support created at the start of the rally.
Resistance Zone: The area of $0.25600 acted as upper resistance and a recent rejection point.
Support Zone: The level of $0.17000 is the strongest short-term support, although the current consolidation level around $0.22240 (dashed line) may be an immediate minor support.
3. Key Technical Indicators:
RSI (6 periods): 48.78921
The RSI is close to the neutral level of 50. This suggests that, after the strong initial rise, the asset is currently neither overbought nor oversold and is in a phase of equilibrium or pause.
Conclusion for your Content:
"$POWER /USDT has shown explosive volatility (+22.19% in 24h), but is now in a consolidation phase. The high volume confirms institutional interest. Traders should watch whether the price manages to break the resistance of $0.25600 to continue the upward trend, or if the consolidation breaks to the downside, with the RSI neutral (48.78) indicating that buying/selling pressure is balanced for now."
#power #POWER/USDT #BinanceBlockchainWeek #bikance #tothemoon