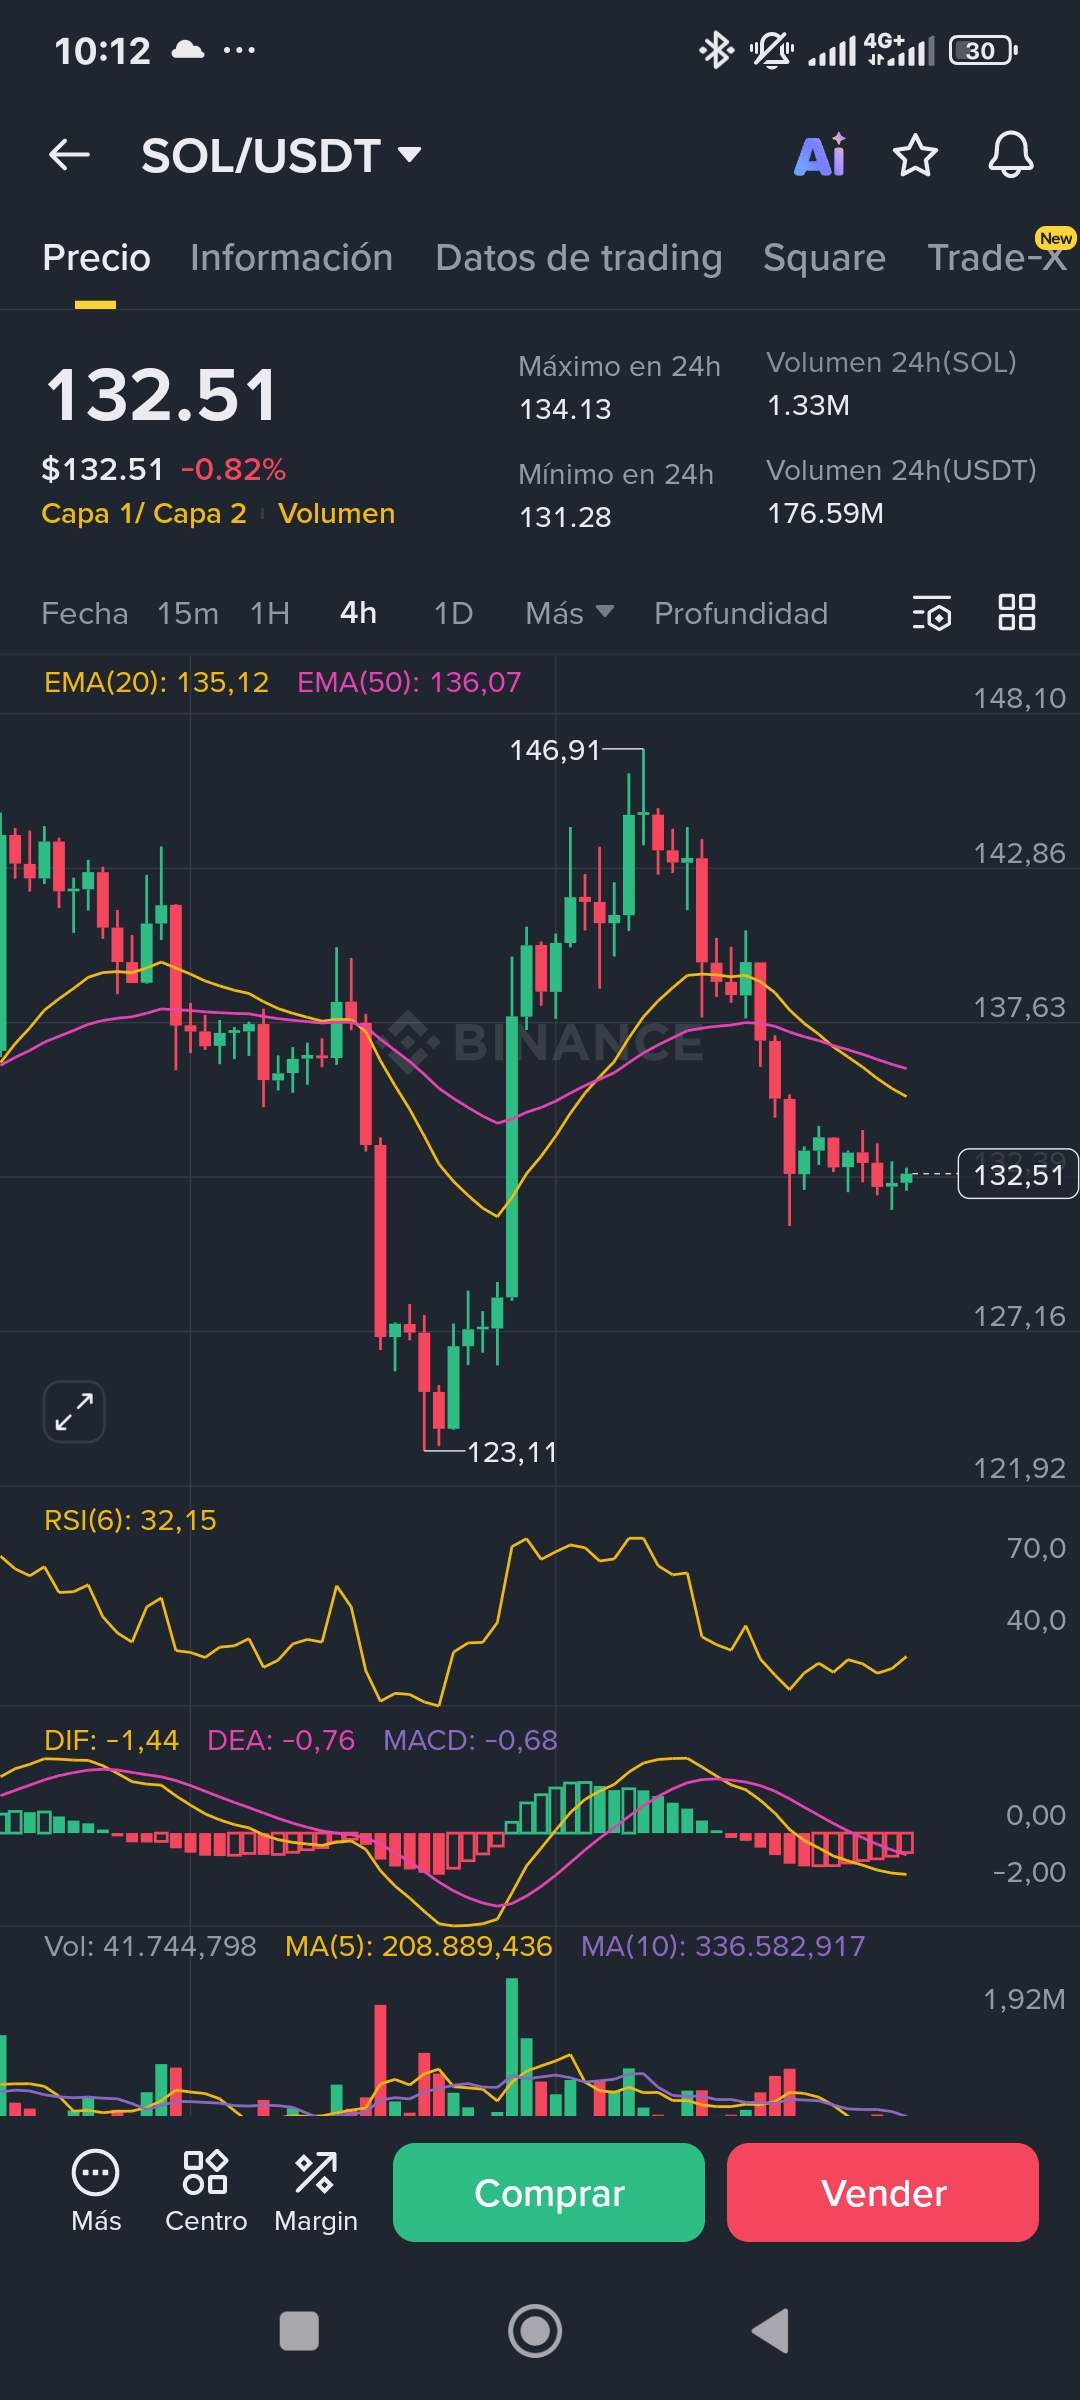
Ticker: SOL/USDT
Time Frame: 4 Hours (4H)
Current Price: $132.51
Solana is undergoing a correction process, struggling to find solid support on the 4-hour chart. The price has significantly retraced from its recent high of $146.91 and is currently trading below the Exponential Moving Averages (EMAs 20 and 50), confirming the short-term bearish momentum.
📉 Key Technical Signals
RSI (32.15): The Relative Strength Index is very close to the oversold zone (30). This is an important signal: selling pressure may be waning, often preceding a technical rebound or a consolidation phase.
MACD (-1.44): The signal is negative and the MACD line is below the DEA, confirming the current correction trend. We need to see a bullish crossover in this indicator to validate a reversal.
Critical Support: The level of $123.11 is the key support to watch. If this level breaks, the correction could deepen.
🎯 Forecast
Bounce (Bullish Scenario): The proximity of the RSI to oversold suggests a high probability of a bounce. If SOL maintains the level of $123.11 and manages to surpass the EMA(20) at $135.12, it would look to recover the level of $146.91.
Continuation (Bearish Scenario): A decisive break below $123.11 would indicate continued weakness and a possible drop towards lower supports.
Conclusion: SOL is in a potential risk/reward zone. Bulls must defend the support at $123.11 for the RSI exhaustion to translate into a recovery move.
#BinanceBlockchainWeek #solana #sol #Binanceholdermmt #BinanceHODLerMorpho