according to the materials of the site - By CFU

LTC continues to experience steady pressure as the market reflects a cautious sentiment towards major assets. The chart shows that the coin is trading near an important support zone, while recent movements remain in line with Bitcoin's trading pattern over the weekends.
LTC maintains a bearish daily structure after closing down during the recent session. The coin remains in a broad multi-month range, but the current position is near the lower half of this structure. The price is trading near the $80 mark, which has served as an important support zone throughout past cycles.
Repeated tests of this area show a weaker response with each pass, and this pattern raises concerns about short-term momentum. Buyers have not shown sustained interest at this level, allowing sellers to control the trend. Market participants continue to monitor this area for signs of a reversal, but no clear changes are observed.
This movement corresponds to the tone of the last message from CRYPTOWZRD, which noted that LTC reflects the overall dynamics of Bitcoin. The message also states that Bitcoin's intraday volatility may continue to determine LTC's direction over the weekend.
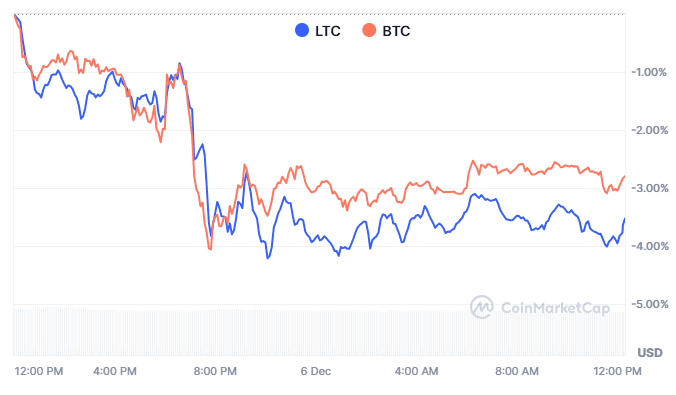
The comparative chart shows that LTC and Bitcoin have moved almost synchronously over the last day. Both assets fell sharply in the middle of the session. LTC demonstrated a stronger decline during this drop, reflecting its tendency for sharper reactions in calmer periods.
LTC is trading around $80.32, with a 24-hour decline exceeding 3%. This drop corresponds to an overall pause in the crypto market as traders seek a clearer direction. Data shows a market capitalization of about $6.15 billion and a volume-to-market-cap ratio of 7%. This ratio signals lower activity and less participation compared to more active trading phases.
The decline in volume, totaling $430 million in 24-hour activity, confirms that many traders remain cautious. This configuration makes LTC sensitive to intraday fluctuations, especially during rapid changes in Bitcoin's price. This trend has persisted over the last sessions and continues to define market dynamics.
The range of LTC remains clearly defined, with resistance near the $100–$102 area. This zone has limited all attempts at recovery since reaching a peak in early November. The arrow on the chart from the previous technical overview points to this area as the next test if buyers enter the game at the support level.
Wider resistance is in the $130–$140 range, while a deeper support level is around the mid-$70s. At the time of writing, LTC is trading between these levels with a weak sentiment as buyers await more substantial confirmation. The structure shows that sellers maintain resilience while the market seeks a new catalyst.
Traders continue to monitor the $78–$82 area as the next key zone. A solid strengthening of this area could pave the way to $90. Movement above this level would disrupt the short-term price sequence of lower and higher. Until then, LTC will take a cautious position as it is pressured by rapid intraday movements of Bitcoin.


