If you have a retirement fund that you don't want to touch, investing in ETFs is the best choice.
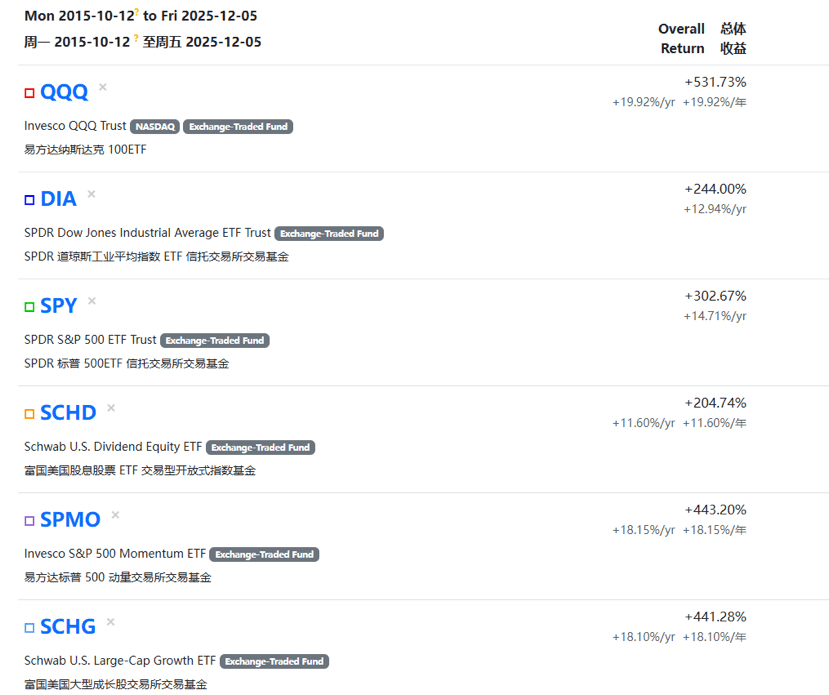
Retrieving the performance of major popular ETFs in the U.S. stock market over the past 10 years.
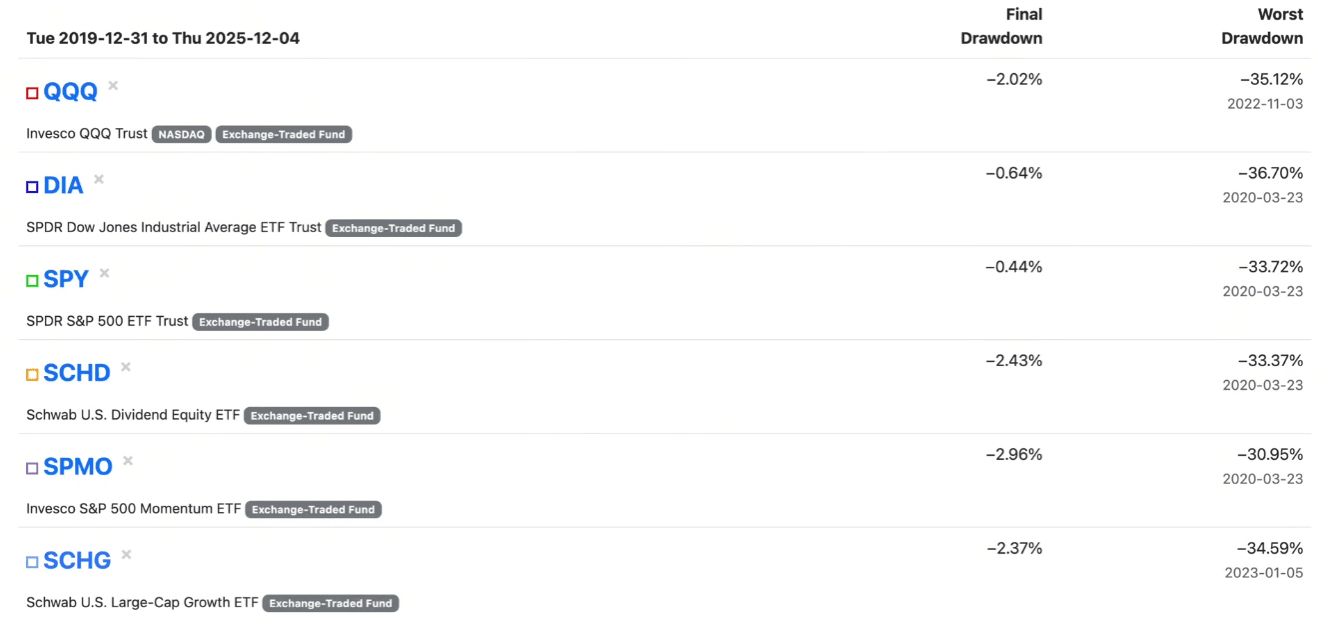
Total return + maximum drawdown + average annual return (including dividends + reinvestment)
QQQ
Introduction: Tracks the Nasdaq-100 index, mainly holding technology giants (such as Apple, Nvidia, Microsoft), focusing on high-growth stocks, with assets exceeding $300 billion and an expense ratio of 0.20%. Suitable for investors seeking high growth, but with high volatility (technology stocks are sensitive to economic cycles).
Analysis: As a representative technology ETF, it outperforms the market but is prone to corrections in bear markets. From 2025 to now, the return is +25%, suitable for long-term growth portfolios, but risk diversification is necessary.
DIA
Characteristics: Tracks the Dow Jones Industrial Average (DJIA), includes 30 blue-chip stocks (such as UnitedHealth, Goldman Sachs), heavy on value stocks, assets over $35 billion, expense ratio 0.16%. Emphasizes stable dividends and mature companies.
Analysis: More conservative, less volatility than QQQ, suitable for income-oriented investors. Return from 2025 to now +15%, strong recession resistance, but limited growth potential.
SPY
Characteristics: Tracks the S&P 500 Index, covers the 500 largest companies in the U.S. (such as technology, finance), balances growth and value, assets over $500 billion, expense ratio 0.09%. Market benchmark ETF provides broad exposure.
Analysis: Most popular core holding, balanced risk/reward. Return from 2025 to now +20%, suitable for beginners or passive investors, but fluctuates with the market.
SCHD
Characteristics: Tracks the Dow Jones U.S. Dividend 100 Index, stock selection based on high dividends and financial health (such as Johnson & Johnson, Home Depot), heavy on value and income, assets over $60 billion, expense ratio 0.06%. Annual dividend yield about 3.5%.
Analysis: Defensive ETF, suitable for retirement investors. Return from 2025 to now +12%, stable dividends, but growth is slower than QQQ.
SPMO
Characteristics: Tracks the S&P 500 Momentum Index, selects strong-performing S&P 500 stocks (such as Nvidia, Meta), heavy momentum strategy, assets over $5 billion, expense ratio 0.13%. Dynamically adjusts holdings to capture upward trends.
Analysis: Suitable for bull markets, return from 2025 to now +30%, but vulnerable in bear markets. Momentum strategy is high risk and high return, requires timing.
SCHG
Characteristics: Tracks the Dow Jones U.S. Large-Cap Growth Total Stock Market Index, major growth stocks (such as Amazon, Tesla), assets over $30 billion, expense ratio 0.04%. Focuses on high-growth companies.
Analysis: Growth ETF, return from 2025 to now +28%, similar to QQQ but with lower expenses. Suitable for long-term holding, but high risk of tech bubble.