The market never lies, but 'volume and price' never deceive.
Only by understanding it can you understand the main force, the trend, and the risks.
This chart breaks down the 12 most common and critical volume-price combinations in the market into:
Pattern → Behavior → The true intention of the market
Definitely worth collecting👇
📌 1. Rising with reduced volume
Prices have risen, but the volume hasn't kept up.
Weaker buying pressure and strength usually indicate a false rebound or passive replenishment.
Be cautious when chasing, as high positions are easy to get trapped.
📌 2. Low position with reduced volume and falling prices
Slow declines and low volume indicate that 'no one is willing to sell.'
Selling pressure is exhausted → Signal of the end of the downtrend.
Wait for a bullish line with increased volume, this is the reversal starting point.
📌 3. Increased volume rise
Only when both volume and price rise can we call it a real increase.
The bulls are truly gaining momentum, the trend has ignited.
Real breakout, real trend, big market starts here.
📌 4. Volume decreases at the bottom
Consolidating + decreasing volume = major players quietly accumulating.
Positions are becoming more stable, it's the 'calm before the storm'.
Wait slowly; it's about to move.
📌 5. Flat volume price increase
The volume hasn't changed, but the price is slowly rising.
This is a sign of stable buying pressure.
A small trend is budding, it may suddenly accelerate later.
📌 6. Volume increases at the bottom and attacks upward
Breaking through after consolidation with increased volume, weak structure is broken.
Indicates that the major players are starting to attack.
Strong buying point! Big market often starts from here.
📌 7. Decrease in decline + successive increase in volume
Falling increasingly slowly, but trading volume is increasing.
Bulls are supporting and collecting positions, bears are exhausted.
Pre-reversal signal, it will take off with just a spark.
📌 8. Flat volume stagnates the rise
The volume hasn't changed, but the price isn't moving, long and short are in a stalemate.
This is the market's 'indeterminate direction period'.
Don't predict, wait for a breakout to act.
📌 9. Volume increases while price drops
The more it falls, the more volume → true selling, true exit.
It's not just a washout; it's a dump.
Must hedge, the trend is downward.
📌 10. Increased volume stagnates the rise
Volume exists, but the price can't push up.
High-level divergence, major players may be unloading.
Danger zone, don't be emotionally attached.
📌 11. Increased volume drop
Panic selling, the trend accelerates to worsen.
A bearish line + increased volume combination is one of the most dangerous patterns.
Stay away! Absolutely don't try to catch the bottom.
📌 12. Volume remains flat but price drops
Slow decline + small volume is a normal correction or consolidation.
The key is whether it stops falling at the support level.
It's not panic, just a break.
📌 Conclusion:
Price is the result, volume is the reason.
Understanding the relationship between volume and price is key to truly understanding the market.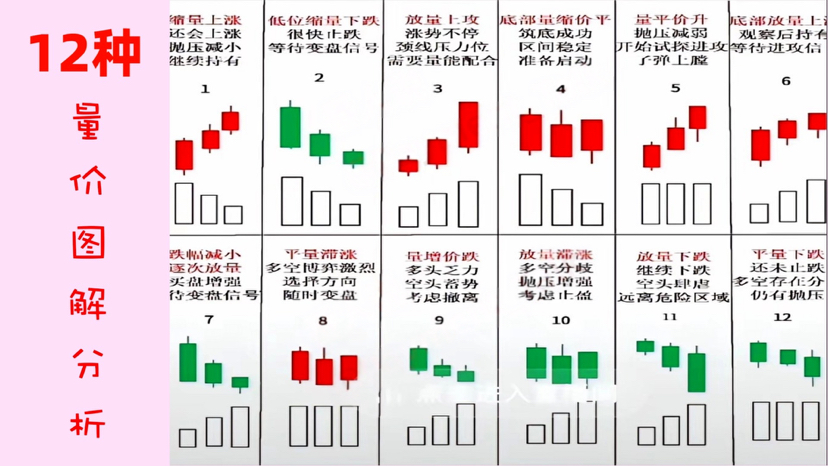
🔁 Suggest saving + forwarding, this chart will save your wallet at critical moments.