Good afternoon, many people like to interpret the market from various news sources. Why did it suddenly rise? Why did it suddenly drop when everything seemed fine? Is there any news? The Federal Reserve's rate cut, Ethereum's upgrade—if we look for news, there will always be something to blame for the market's actions. The influence of news is always temporary; ultimately, we must return to technical analysis. Here at Zhongliang, everything starts from the market itself, rationally analyzing from the structure of the candlestick chart.
The daily K-line's rebound adjustment has already been completed. The upper Bollinger band is opening downwards under pressure, and the middle band is also opening downwards. Currently, the price is fluctuating around the middle band for correction. The MACD bullish momentum continues to shrink, and the KDJ three lines have converged to form a death cross downwards. The weekly K-line's Bollinger band's middle and lower bands are both opening downwards. The price is currently under repair around the lower band, with MACD bearish momentum continuing to expand. This is the information that the naked K can provide us. Next, we will interpret the market from the larger trend and structure.
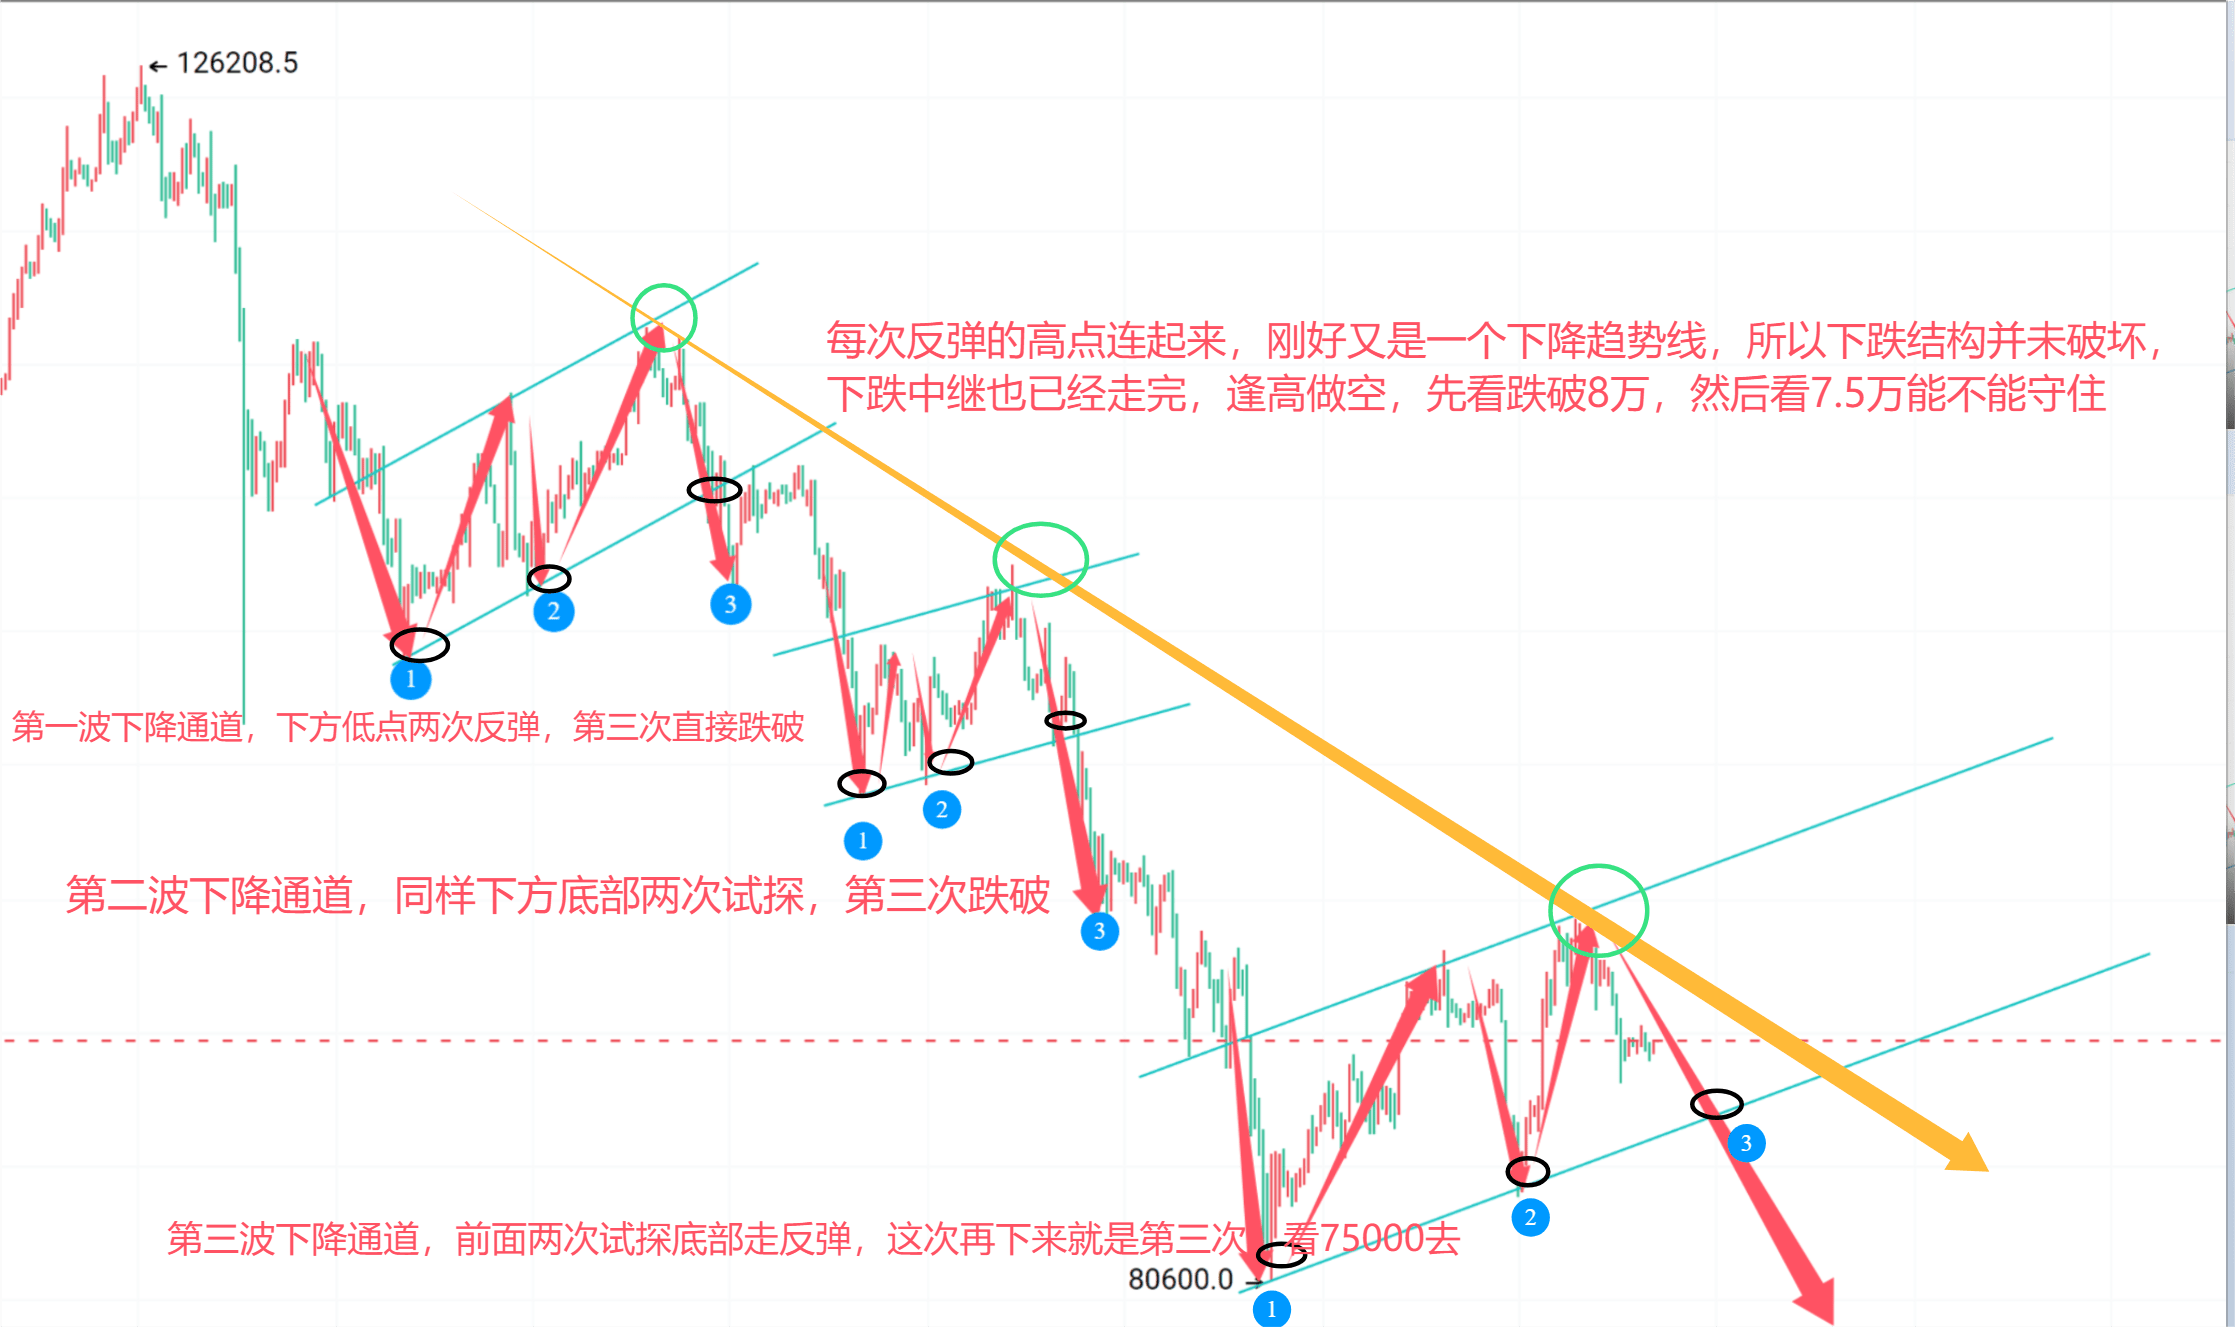
As shown in the diagram, Bitcoin has been in a downward process since reaching a peak at 126200. Currently, it is still in a phase of rising and falling. We are currently moving through the third descending channel. The first channel started from 103470, which is the bottom, with a rebound peak at 116380, forming a descending trend channel. After testing the bottom twice, it broke down on the third attempt, breaking the descending trend channel and moving into the next price channel. The second price channel has a bottom at 98888, which provided support, with a rebound peak reaching 107470, also testing the bottom twice, then breaking down completely on the third attempt, opening up downward space. Currently, we are moving through the third price channel, with the bottom at 80600 providing support for a rebound. The highest rebound has reached 94100, and we are currently in a retracement phase, with the lower bottom also being tested twice. According to the patterns of the previous two waves, this wave should break below this bottom line, heading to a new low, a lower position.
Of course, the above analysis is just a deduction and conclusion drawn from past trends. Looking at the high points of each rebound, if we connect the high points of these three rebounds into a line, it just happens to form a descending trend line. Therefore, regardless of the angle of analysis, the bearish trend remains unchanged, without a doubt! No matter how you shout slogans, the previous high of 126200 is currently in a rising and falling phase, and this is a fact. In fact, there is really no need to get entangled in whether a bull market exists or when it will return; you just need to manage the daily and weekly volatility well!
In summary, the viewpoint on Bitcoin for next week is to short at highs. In the live stream on Friday night, we provided short positions at 90500 and 3100. Hold on tight and don't exit, as this could very well be the highest short position for next week. For those without short positions, watch for a rebound. The upper levels at 90500 and 91500 present opportunities to short at high volatility. For Ethereum, levels at 3100 and 3190 also provide opportunities for high short positions.
The above outlines the weekly strategy for next week, and everyone can read it multiple times to digest it thoroughly. If everyone can get 200 likes, tonight, Zhongliang will have a live chat with everyone about the detailed logic behind this journey of shorting. Brothers, can we meet tonight to chat? It depends on your cohesion. For those who are brothers, give Zhongliang some likes!#比特币VS代币化黄金