
The crypto market is entering a week or weeks that promise to be turning points. We have already written about this in our recent analyses, but we will reiterate once more - strong prospects for a market turnaround upwards are currently indicated by all key metrics according to our indicator:
- dominance of stablecoins USDT+USDC,
- TOTAL (total capitalization of the cryptocurrency market),
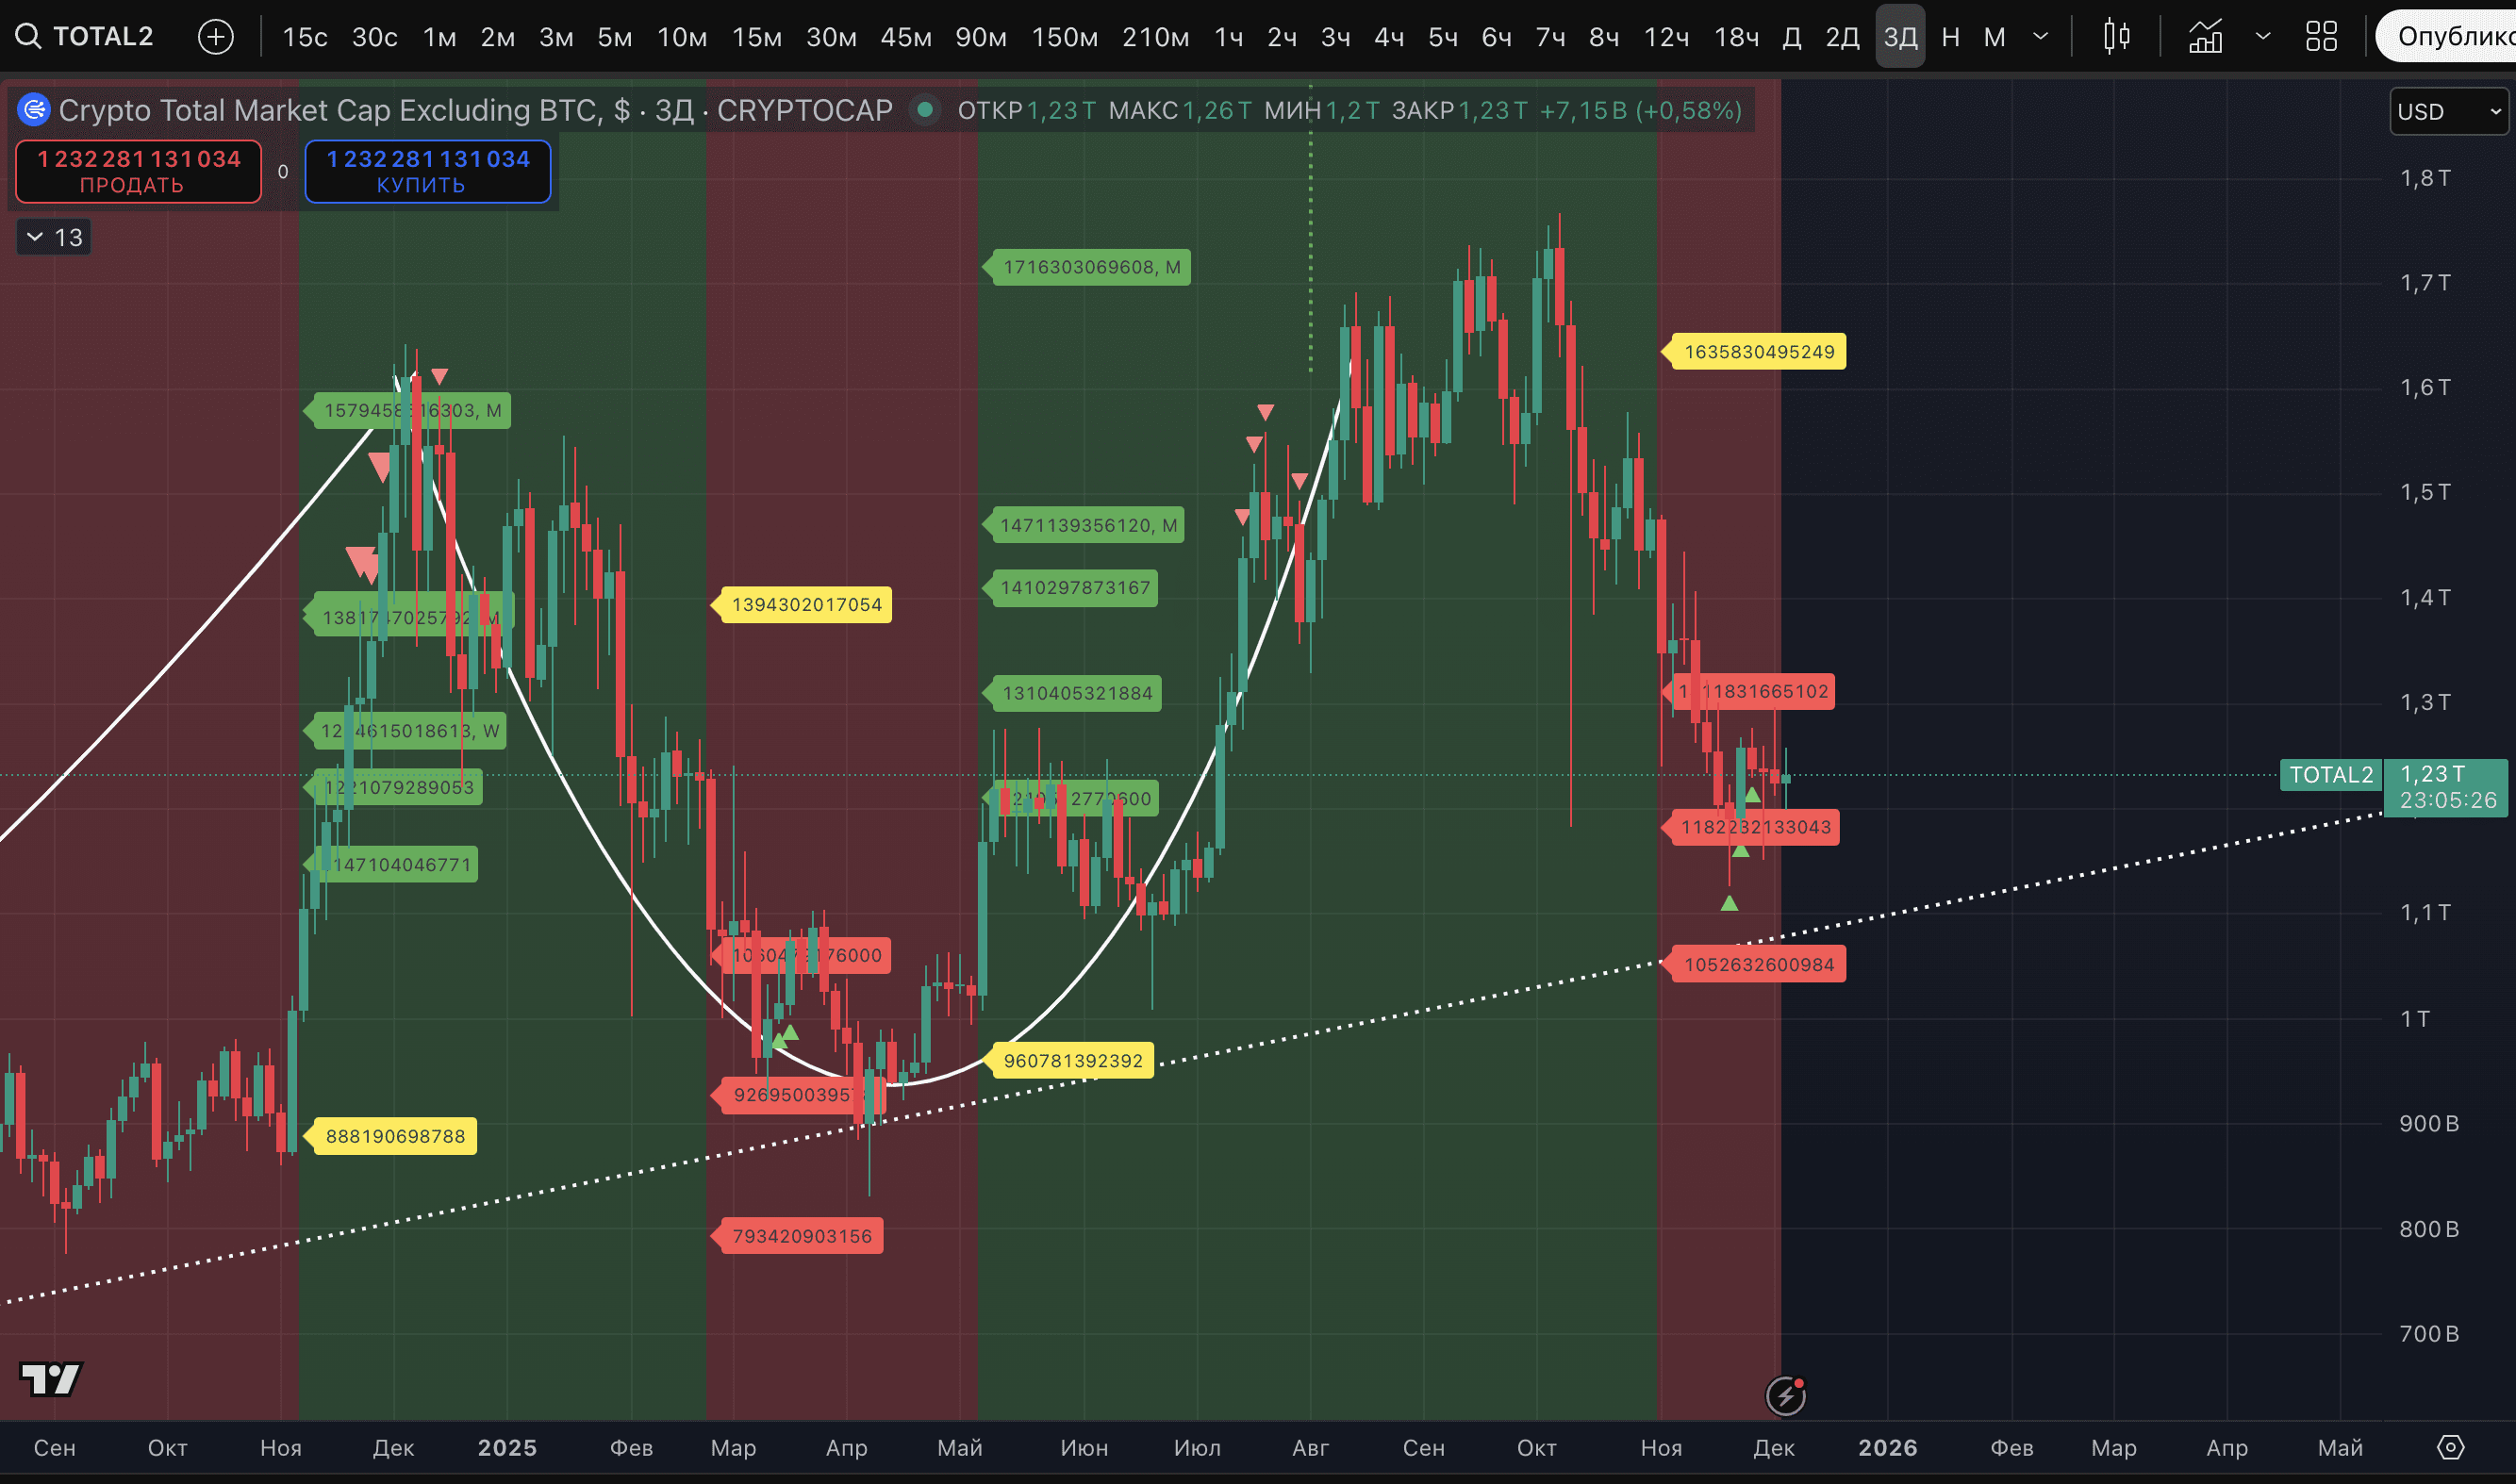
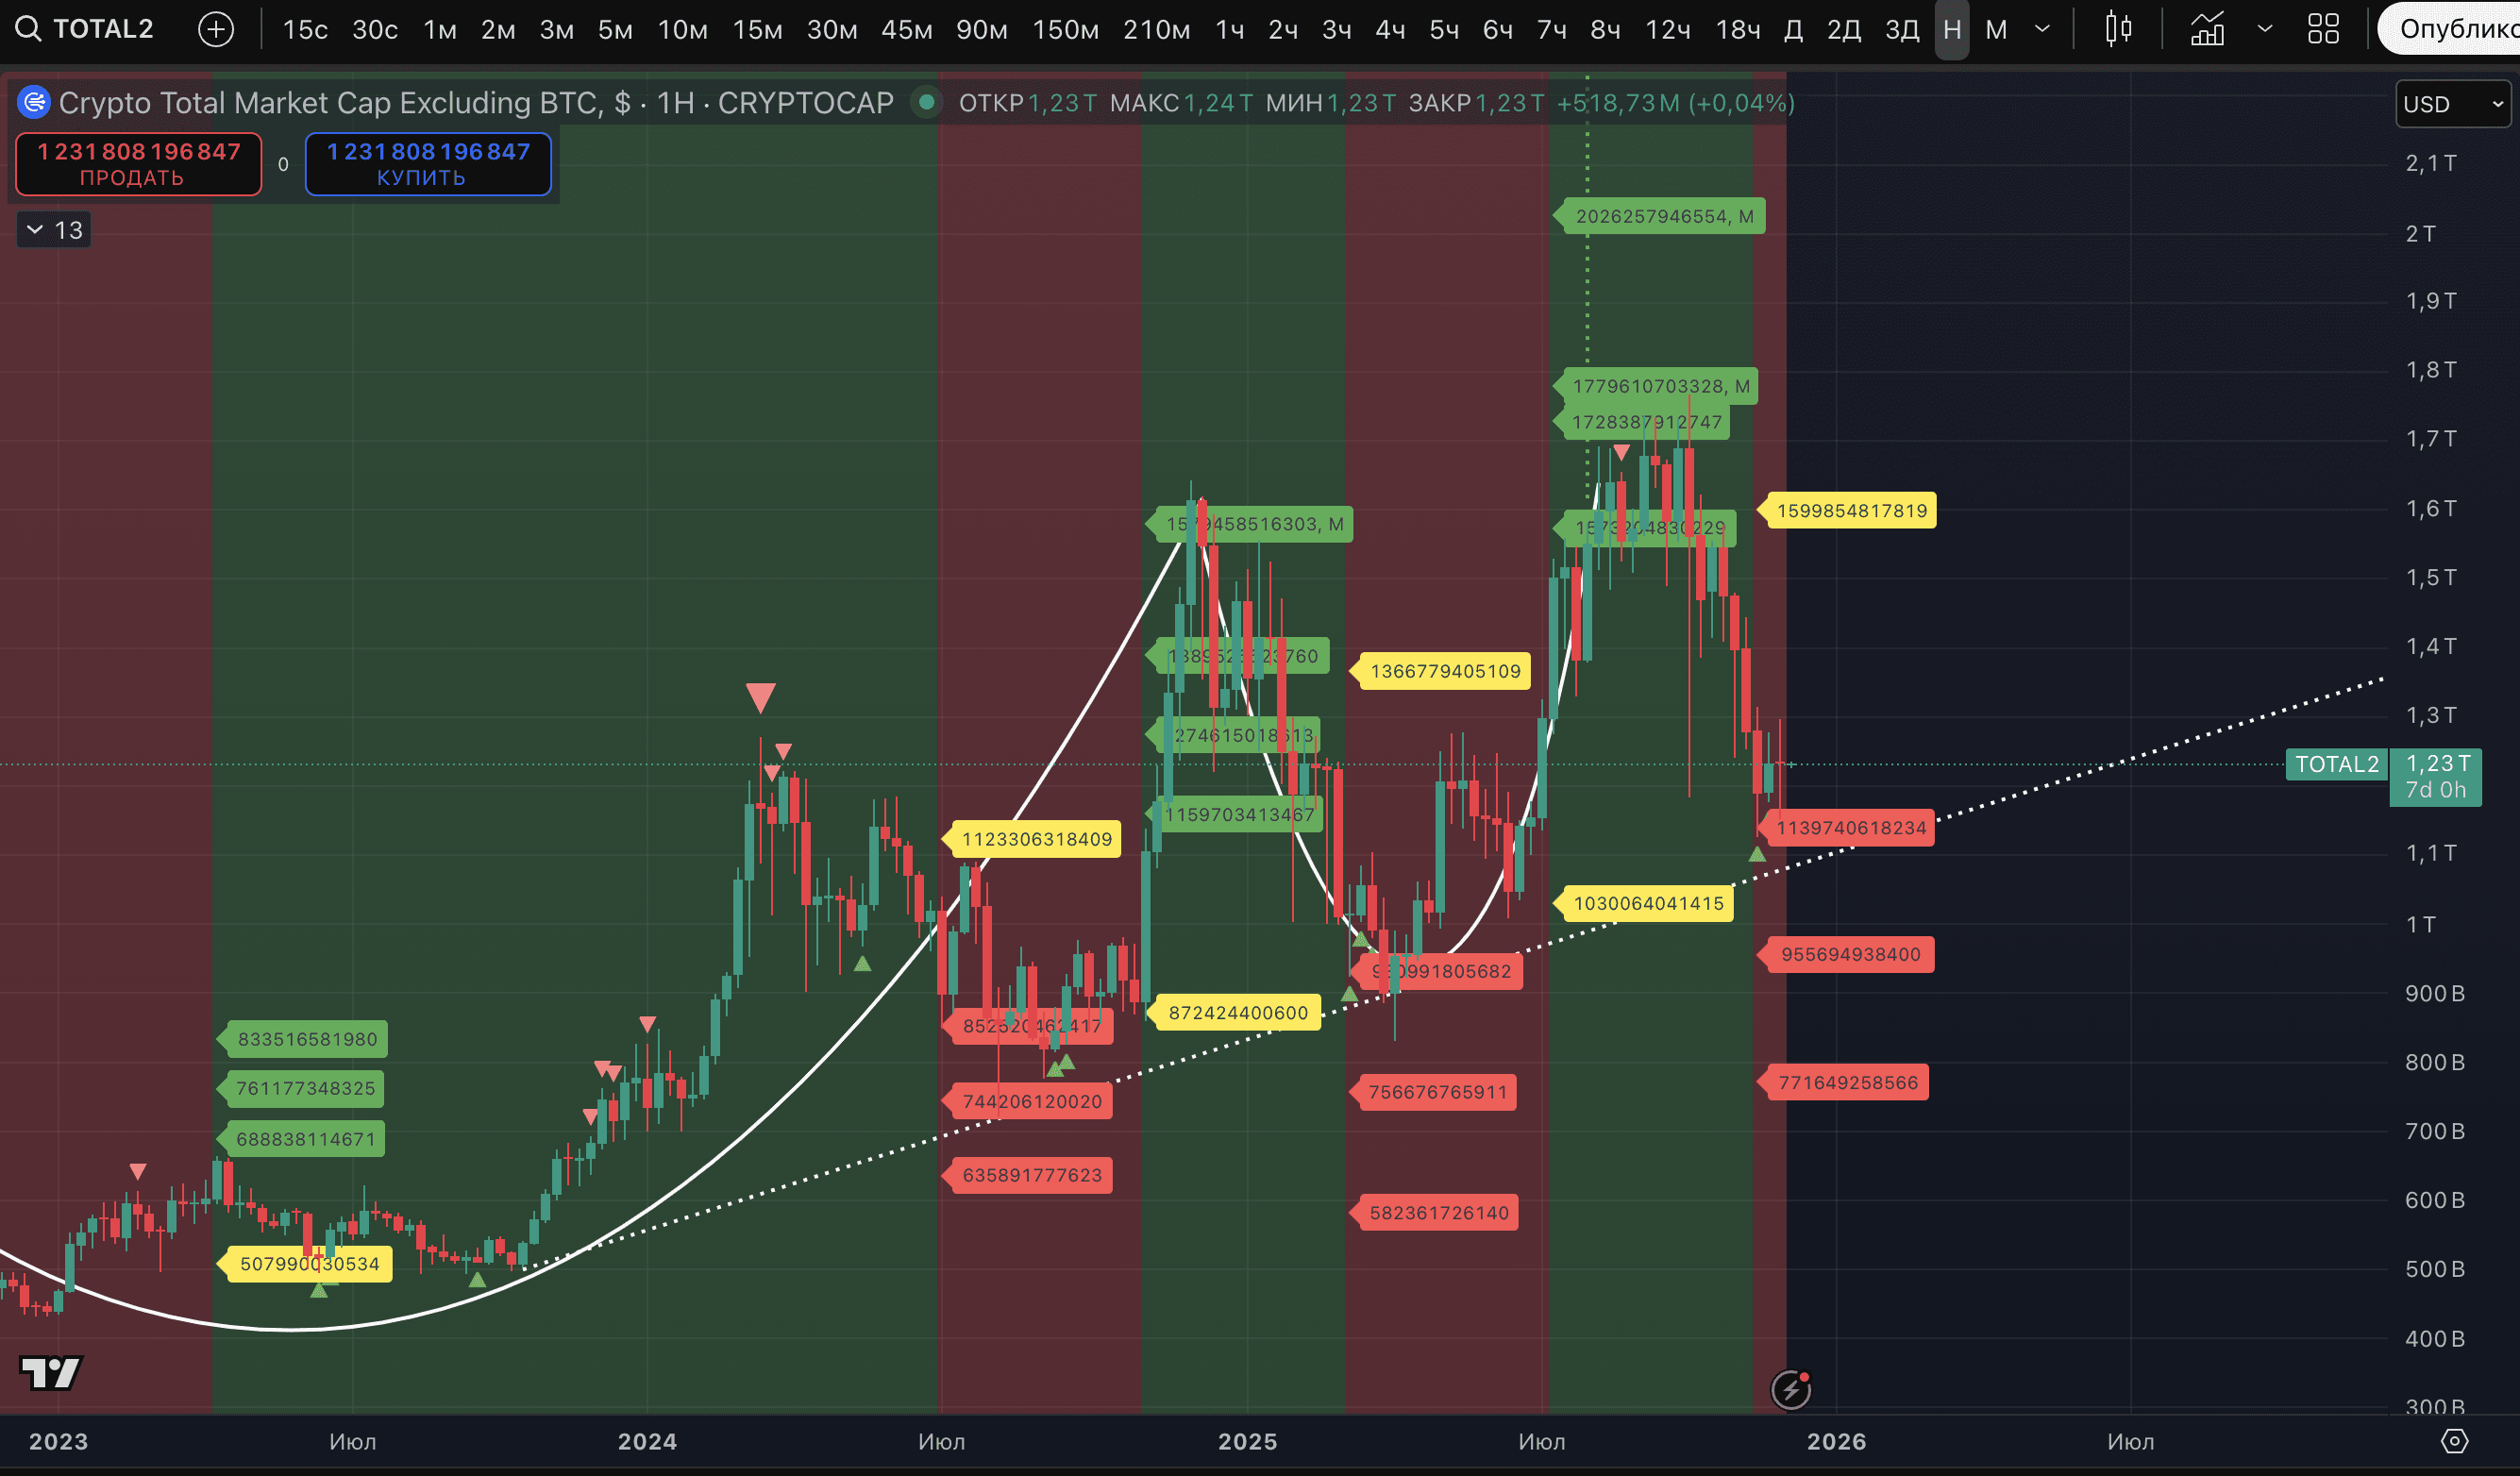
- TOTAL2 (capitalization of the cryptocurrency market excluding BTC),
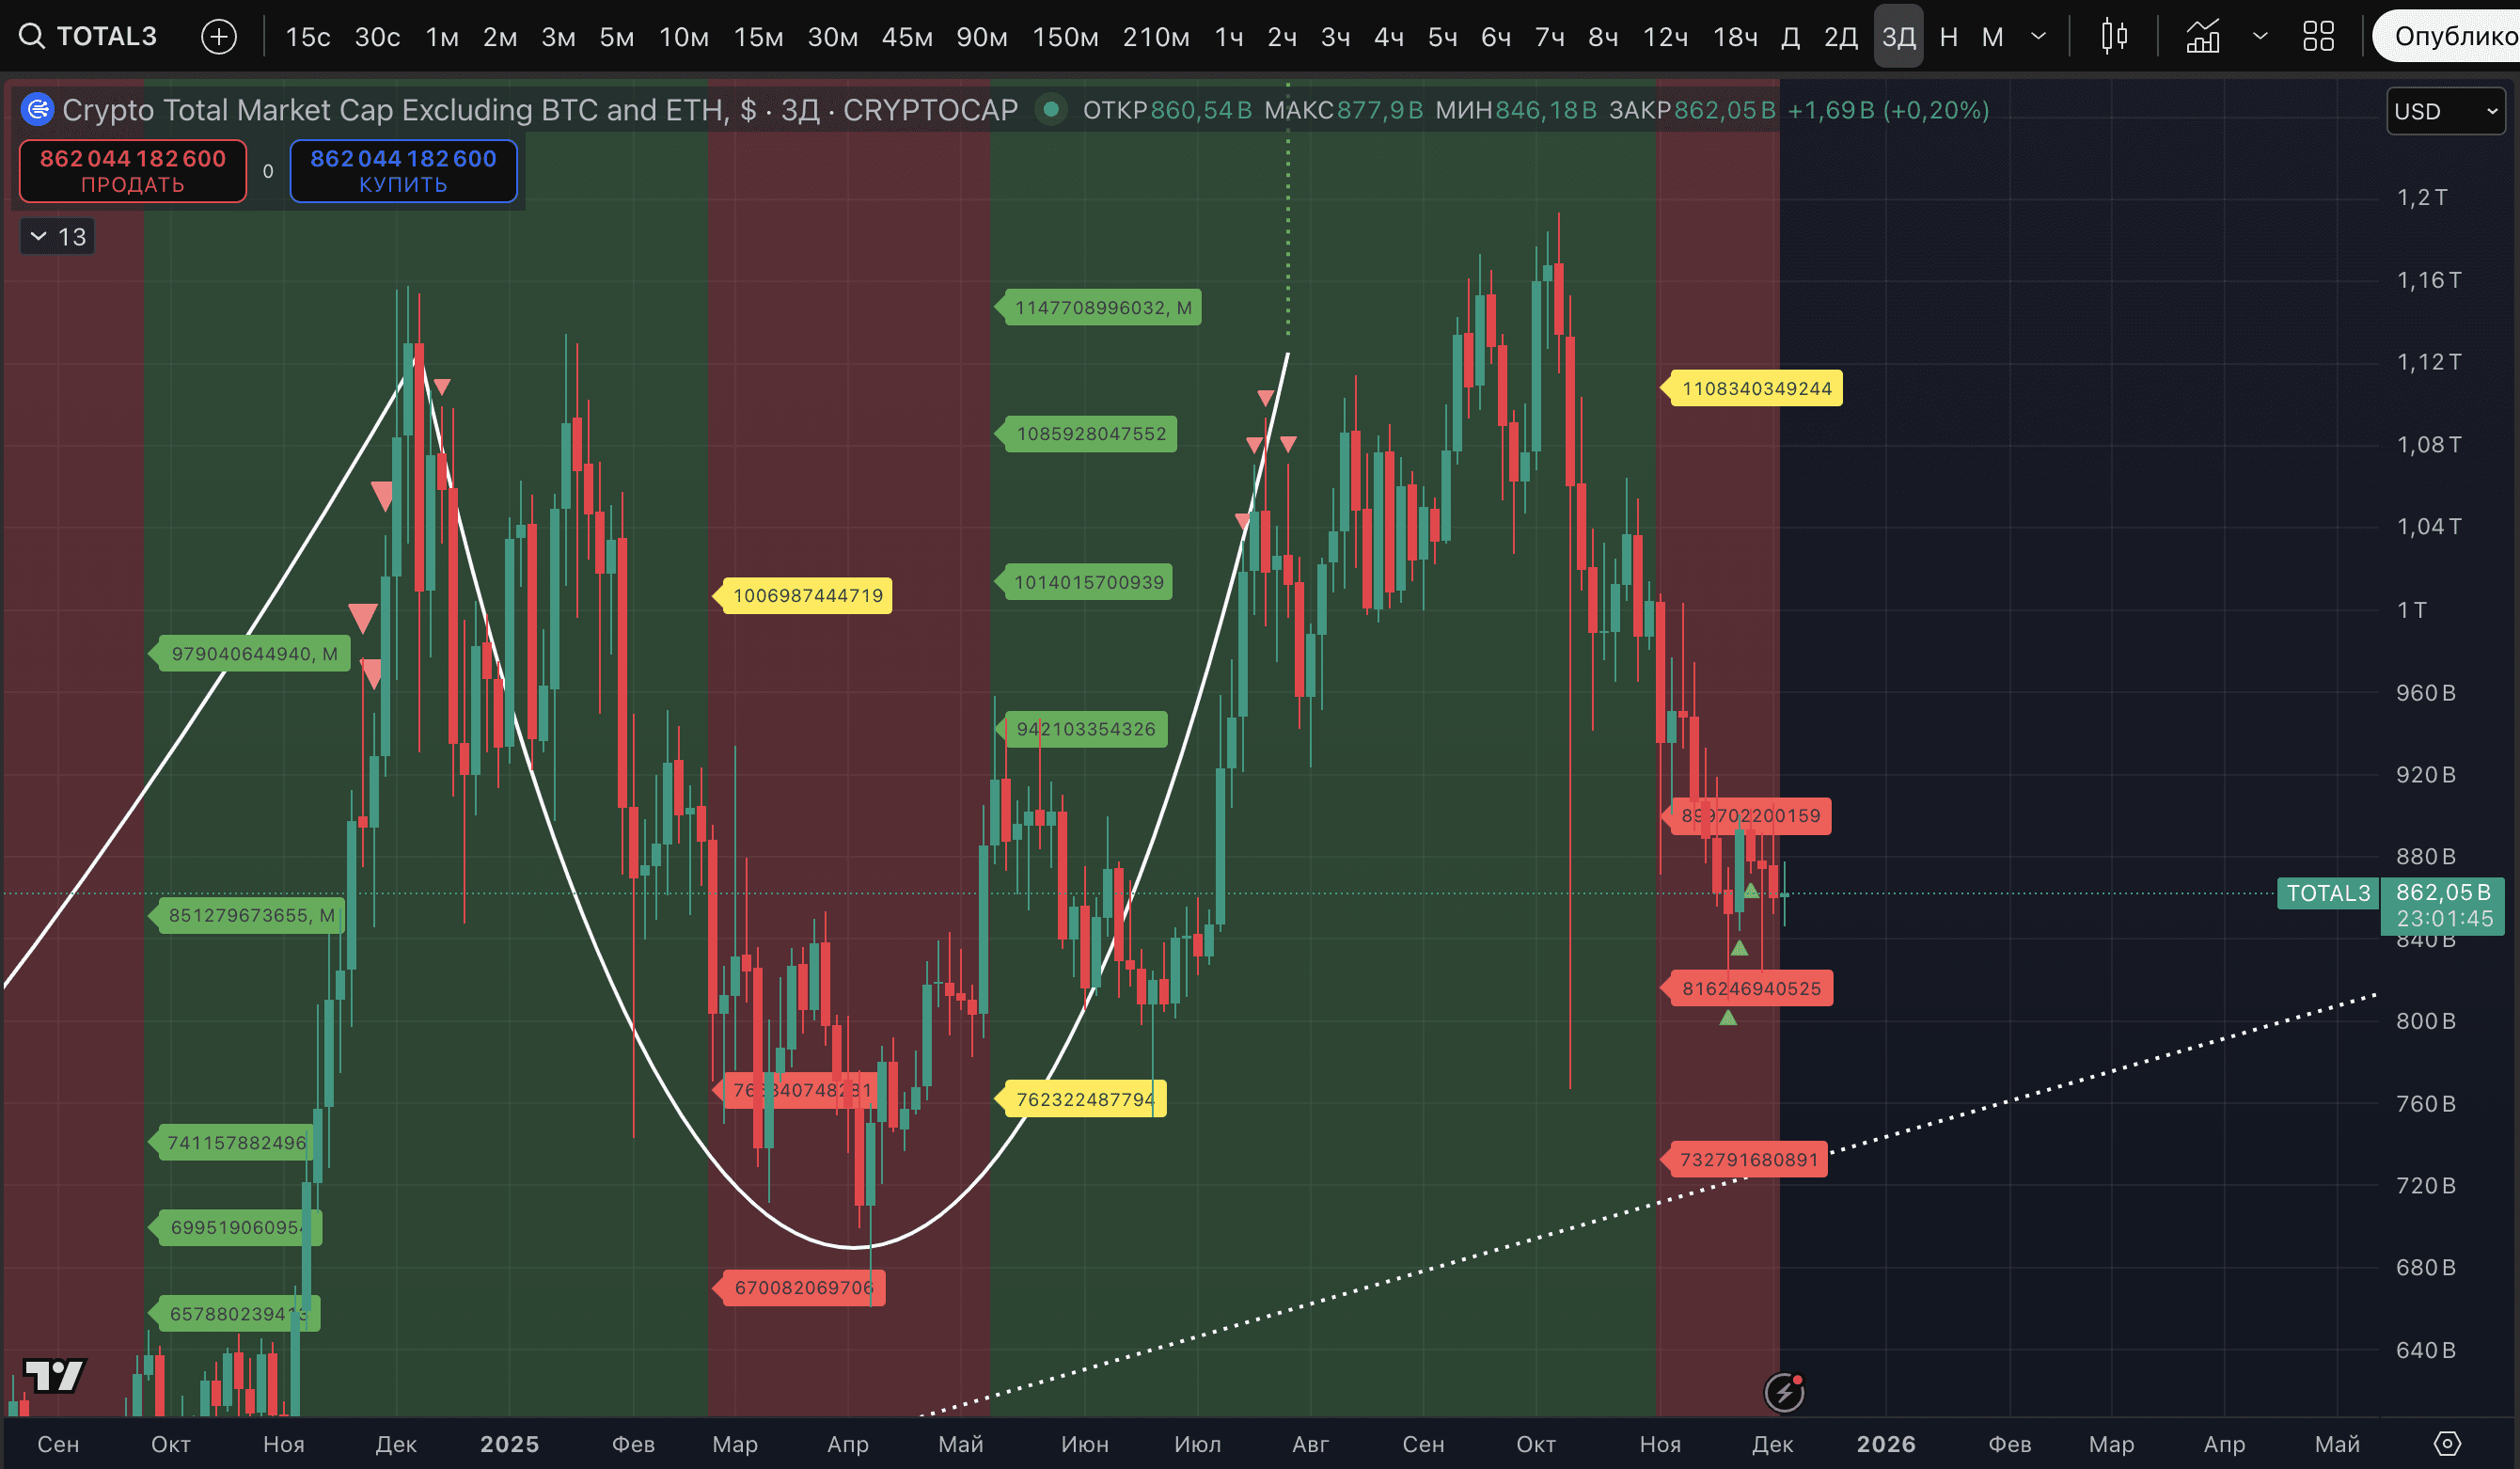
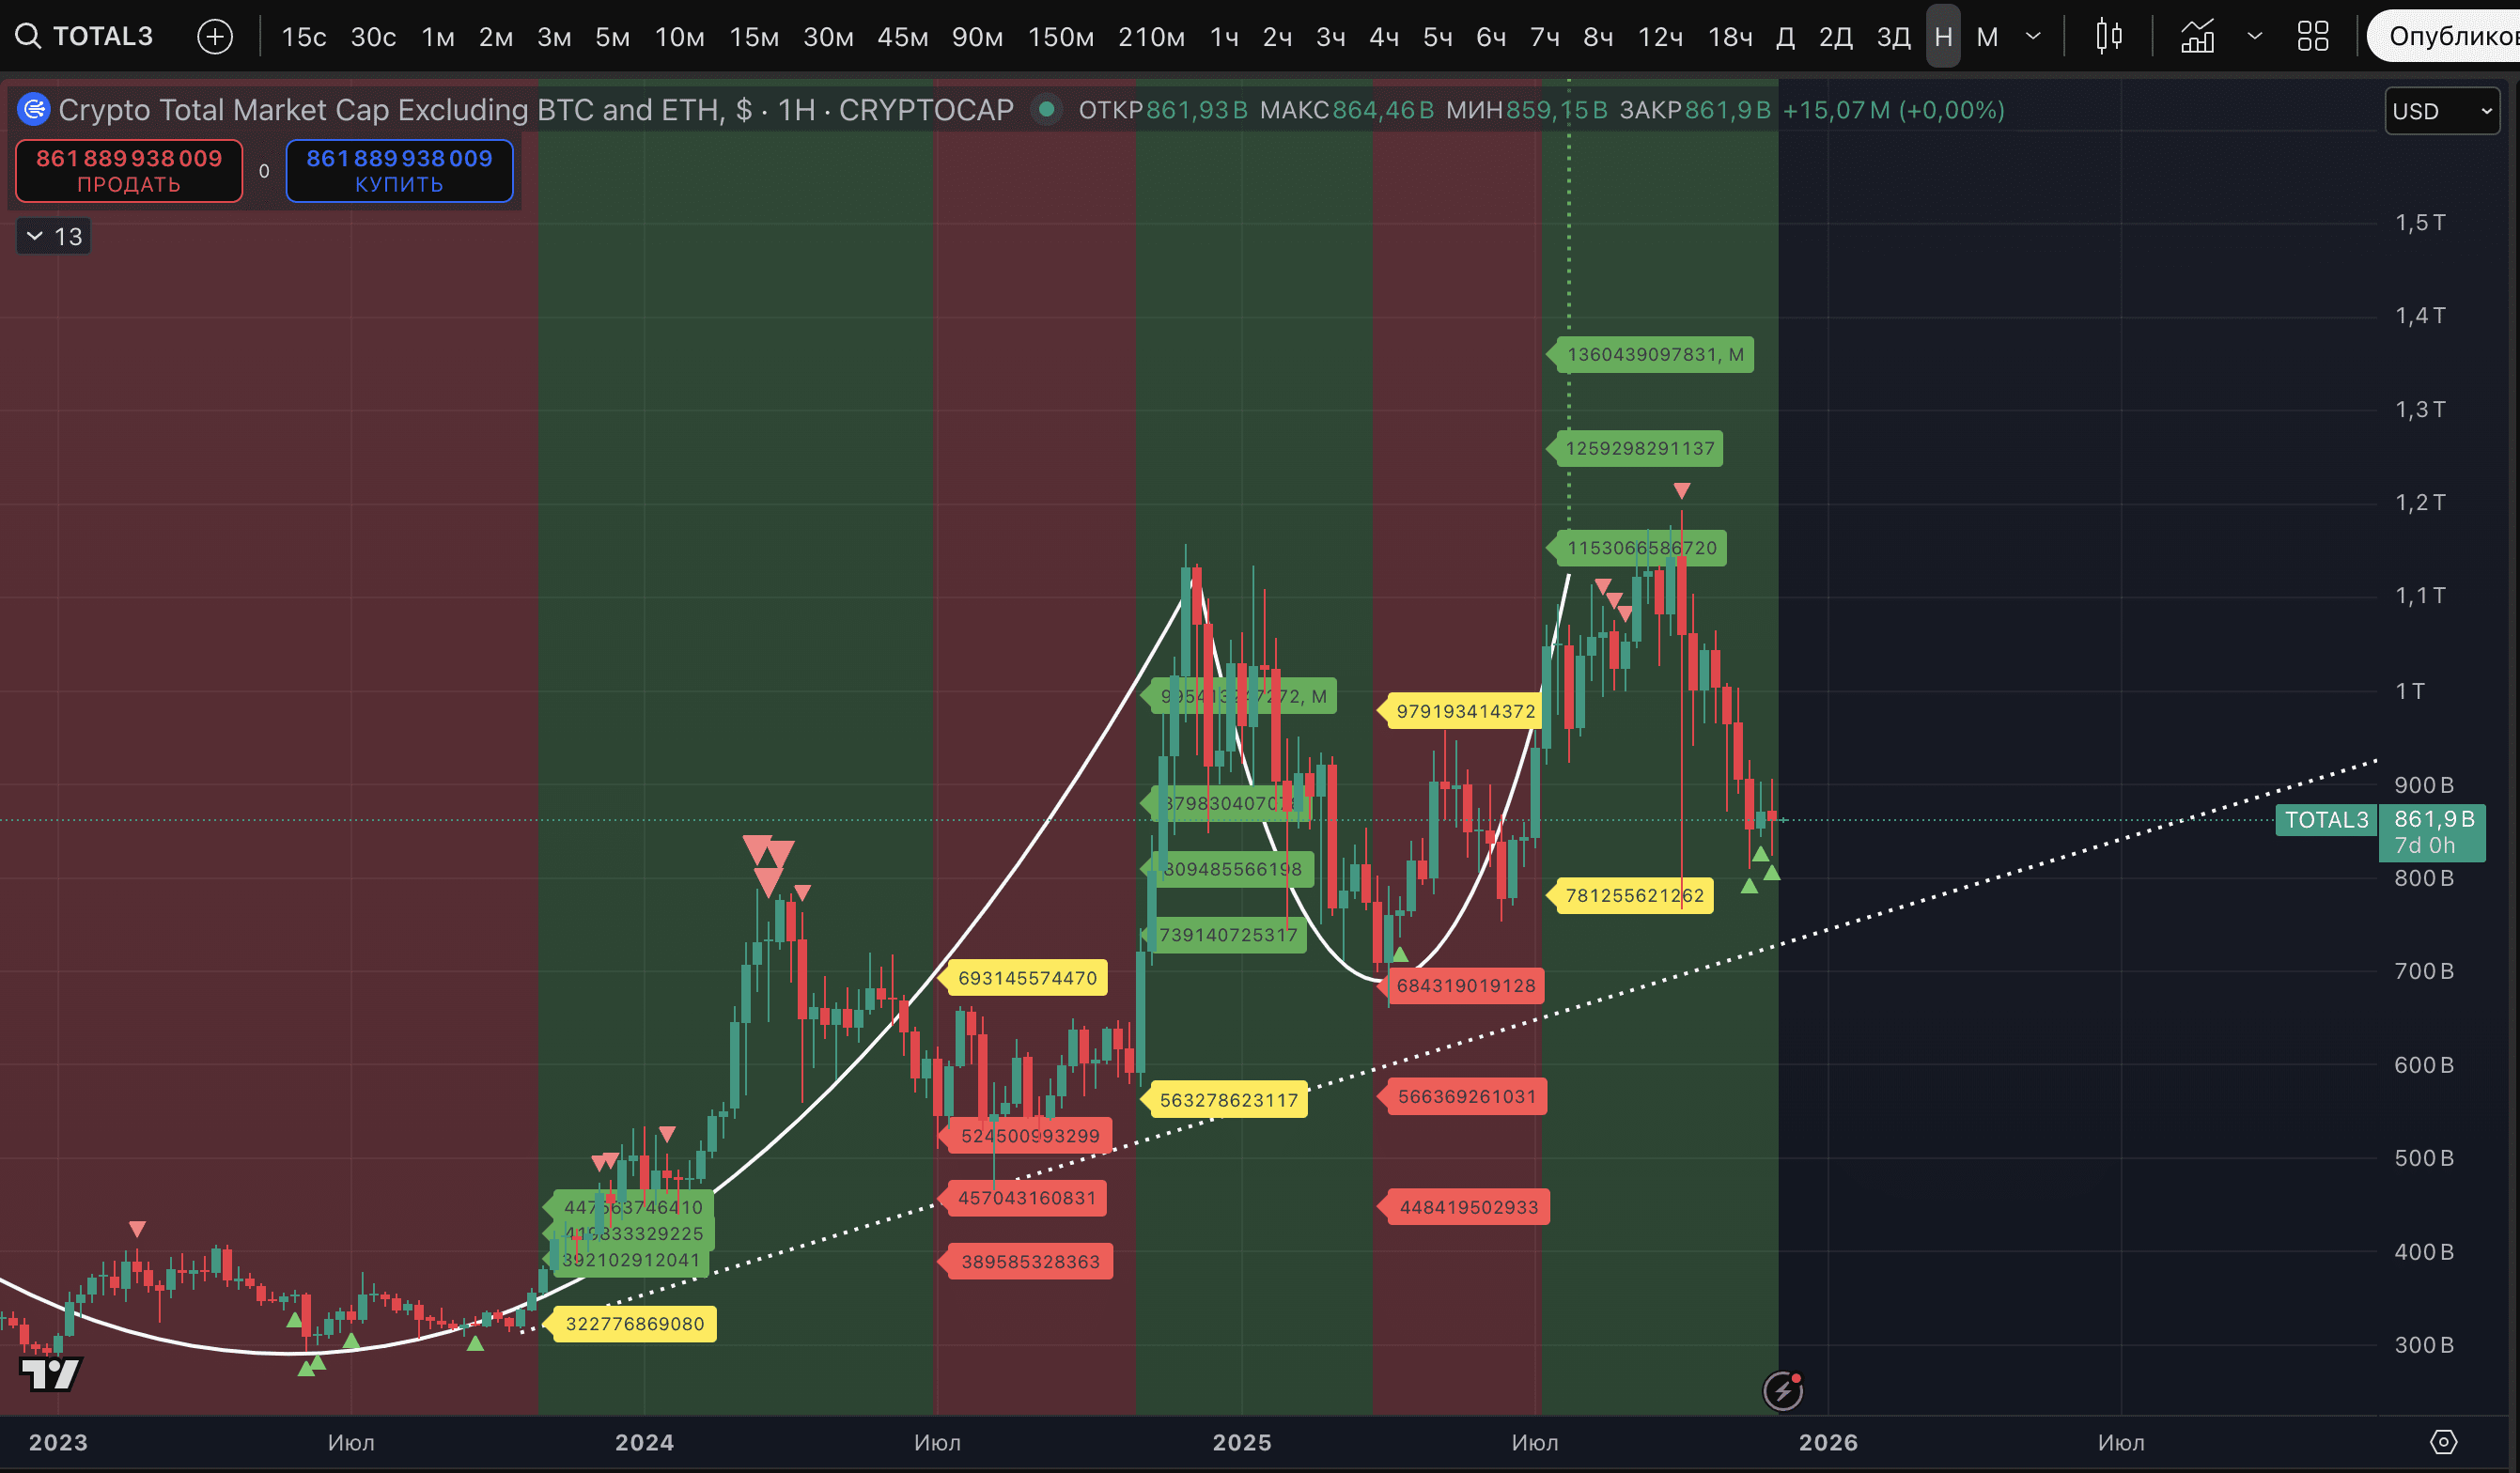
- TOTAL3 (capitalization of the cryptocurrency market excluding BTC and ETH),
- OTHERS (capitalization of the cryptocurrency market excluding the TOP-10).
What unites all these metrics right now according to our indicator? The same signals:
- three potential low marks (for stablecoin dominance - high) out of three possible on the 3-day timeframe,
- one to three potential low marks (for stablecoin dominance - high) out of three possible on the weekly timeframe.
A re-low squeeze - yes, it is possible. But overall, we consider the chances that even this current week will be a reversal one to be high. Is it worth mentioning the 'Santa Claus rally' - that's a good question. After the failed uptober and moonvember. Plus, statistically, if November is red for BTC, it is often red in December as well.
But the combination of reversal marks on these two key timeframes for the medium term is very important. This is not a guarantee, but it is a chance that historically has worked out excellently. This can be seen from the screenshots.
We will show screenshots for each of the metrics, both timeframes.
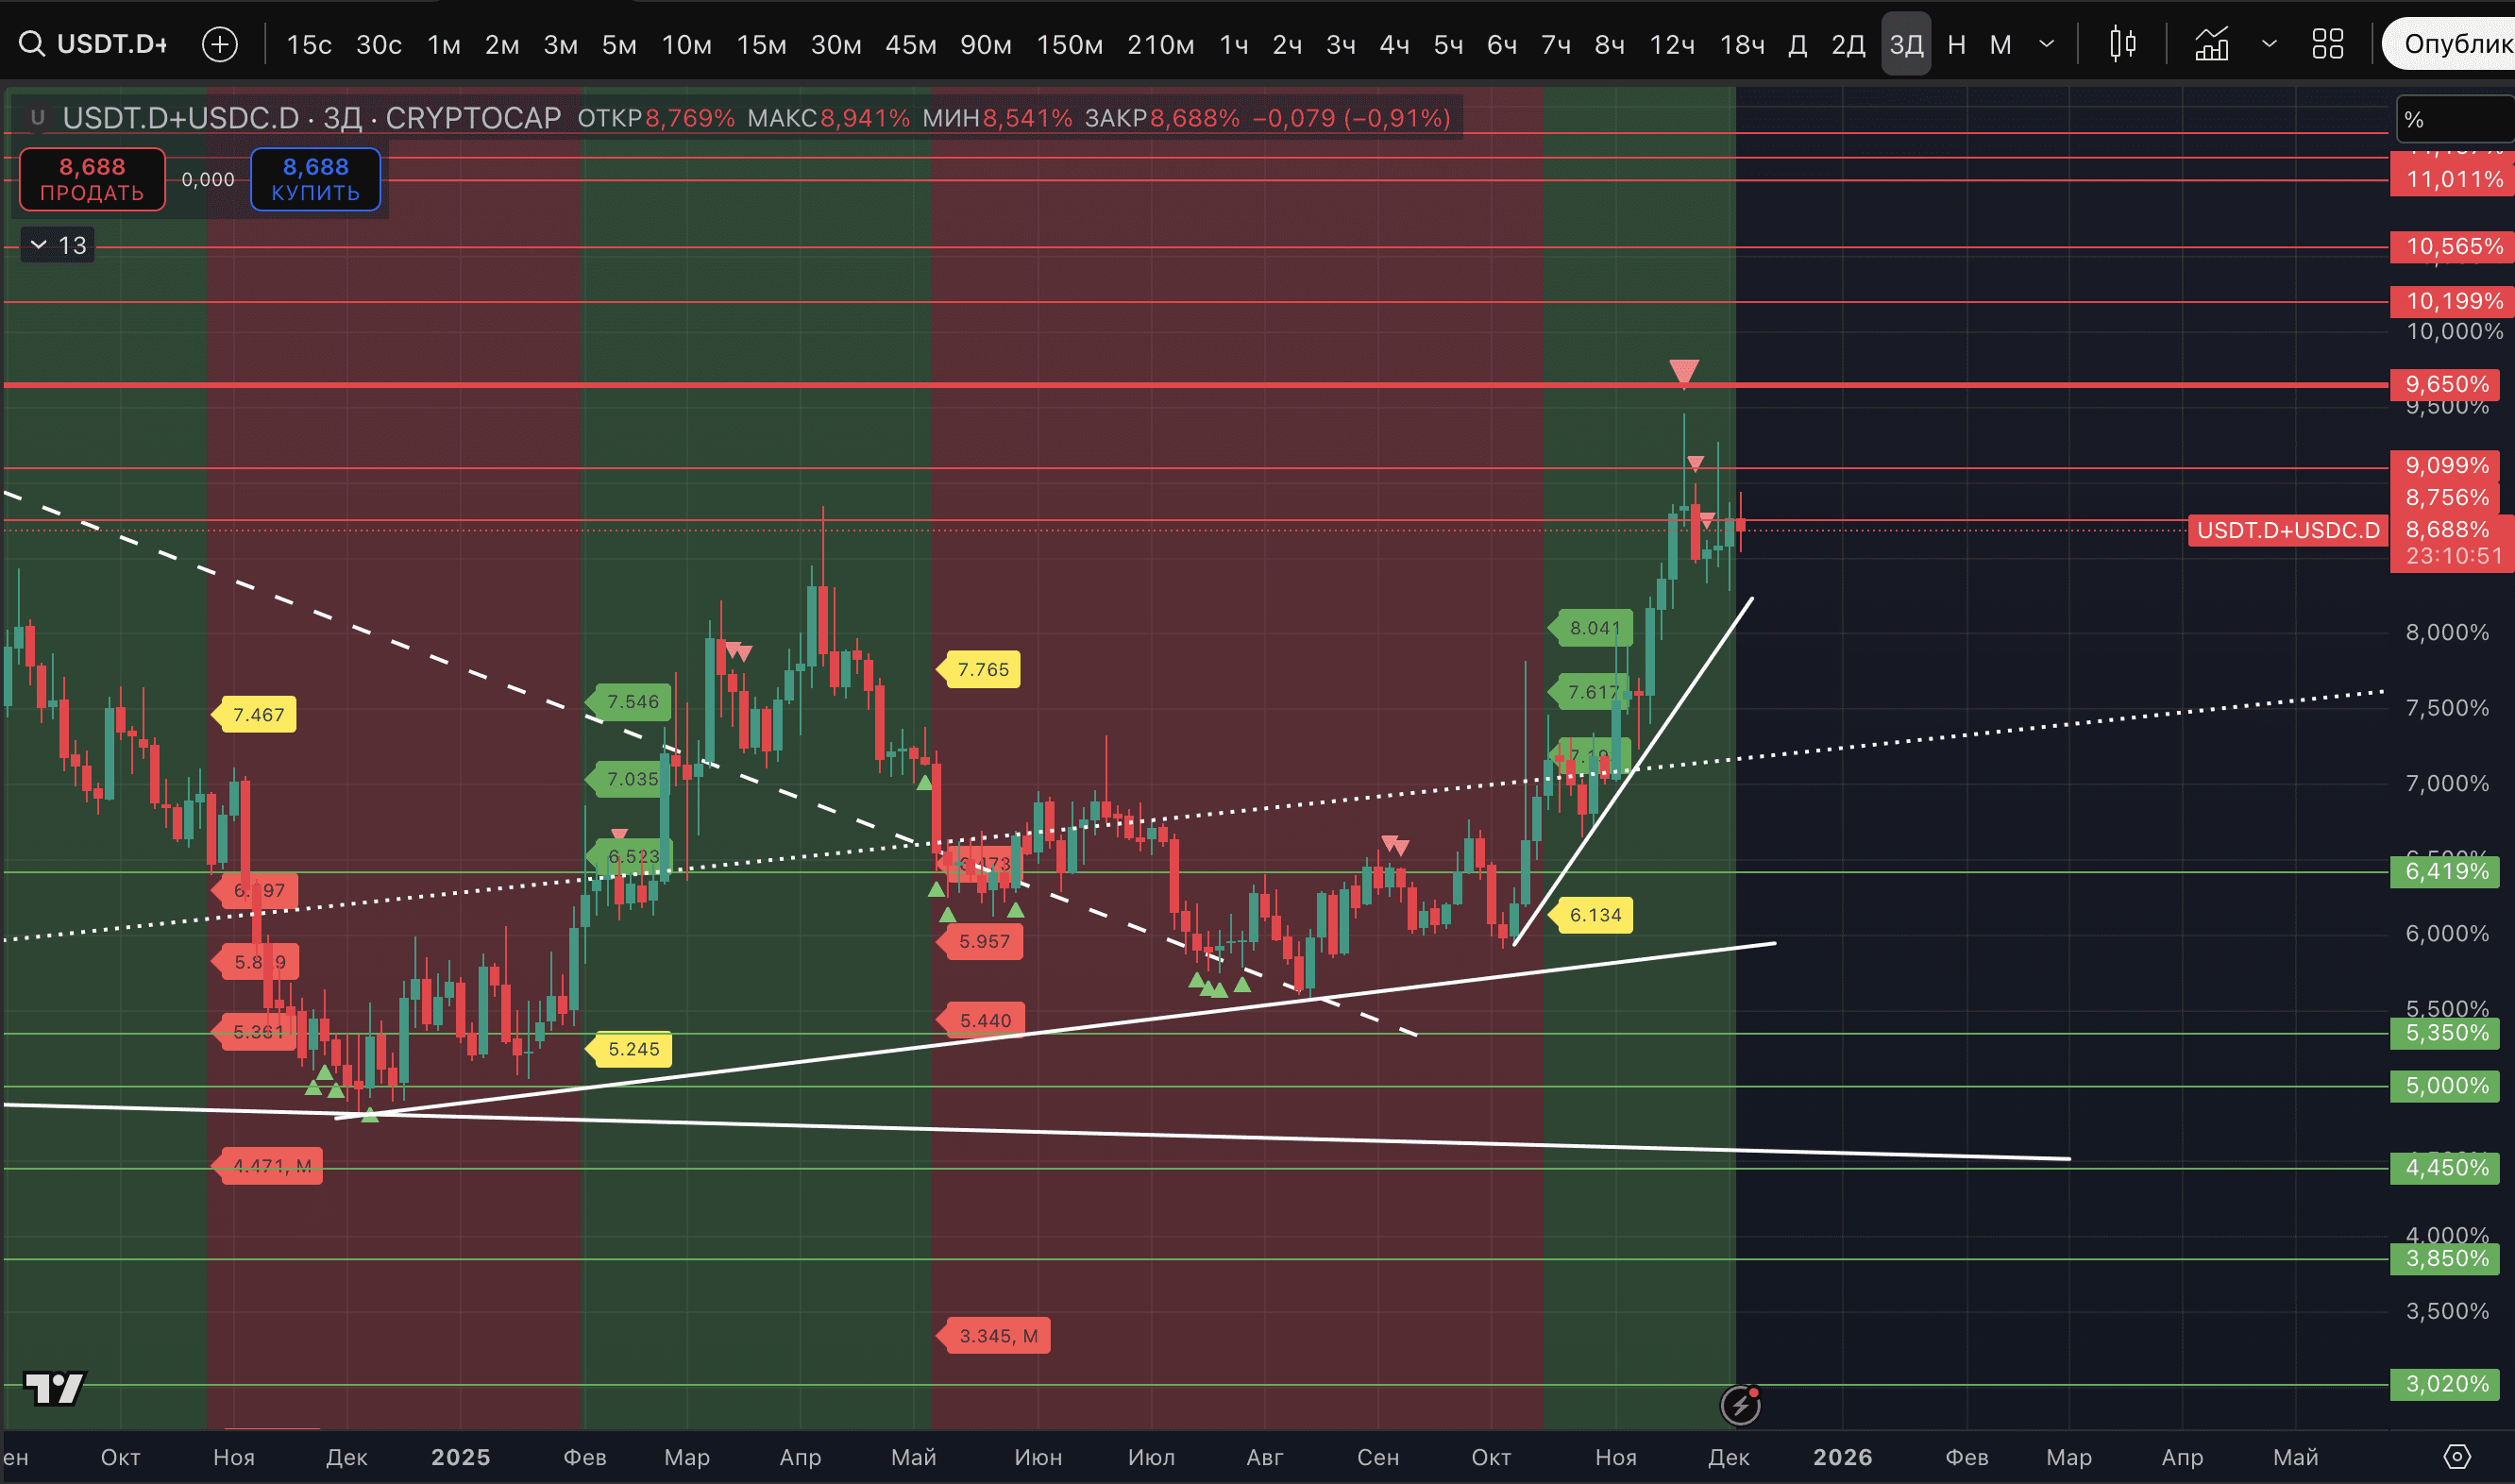
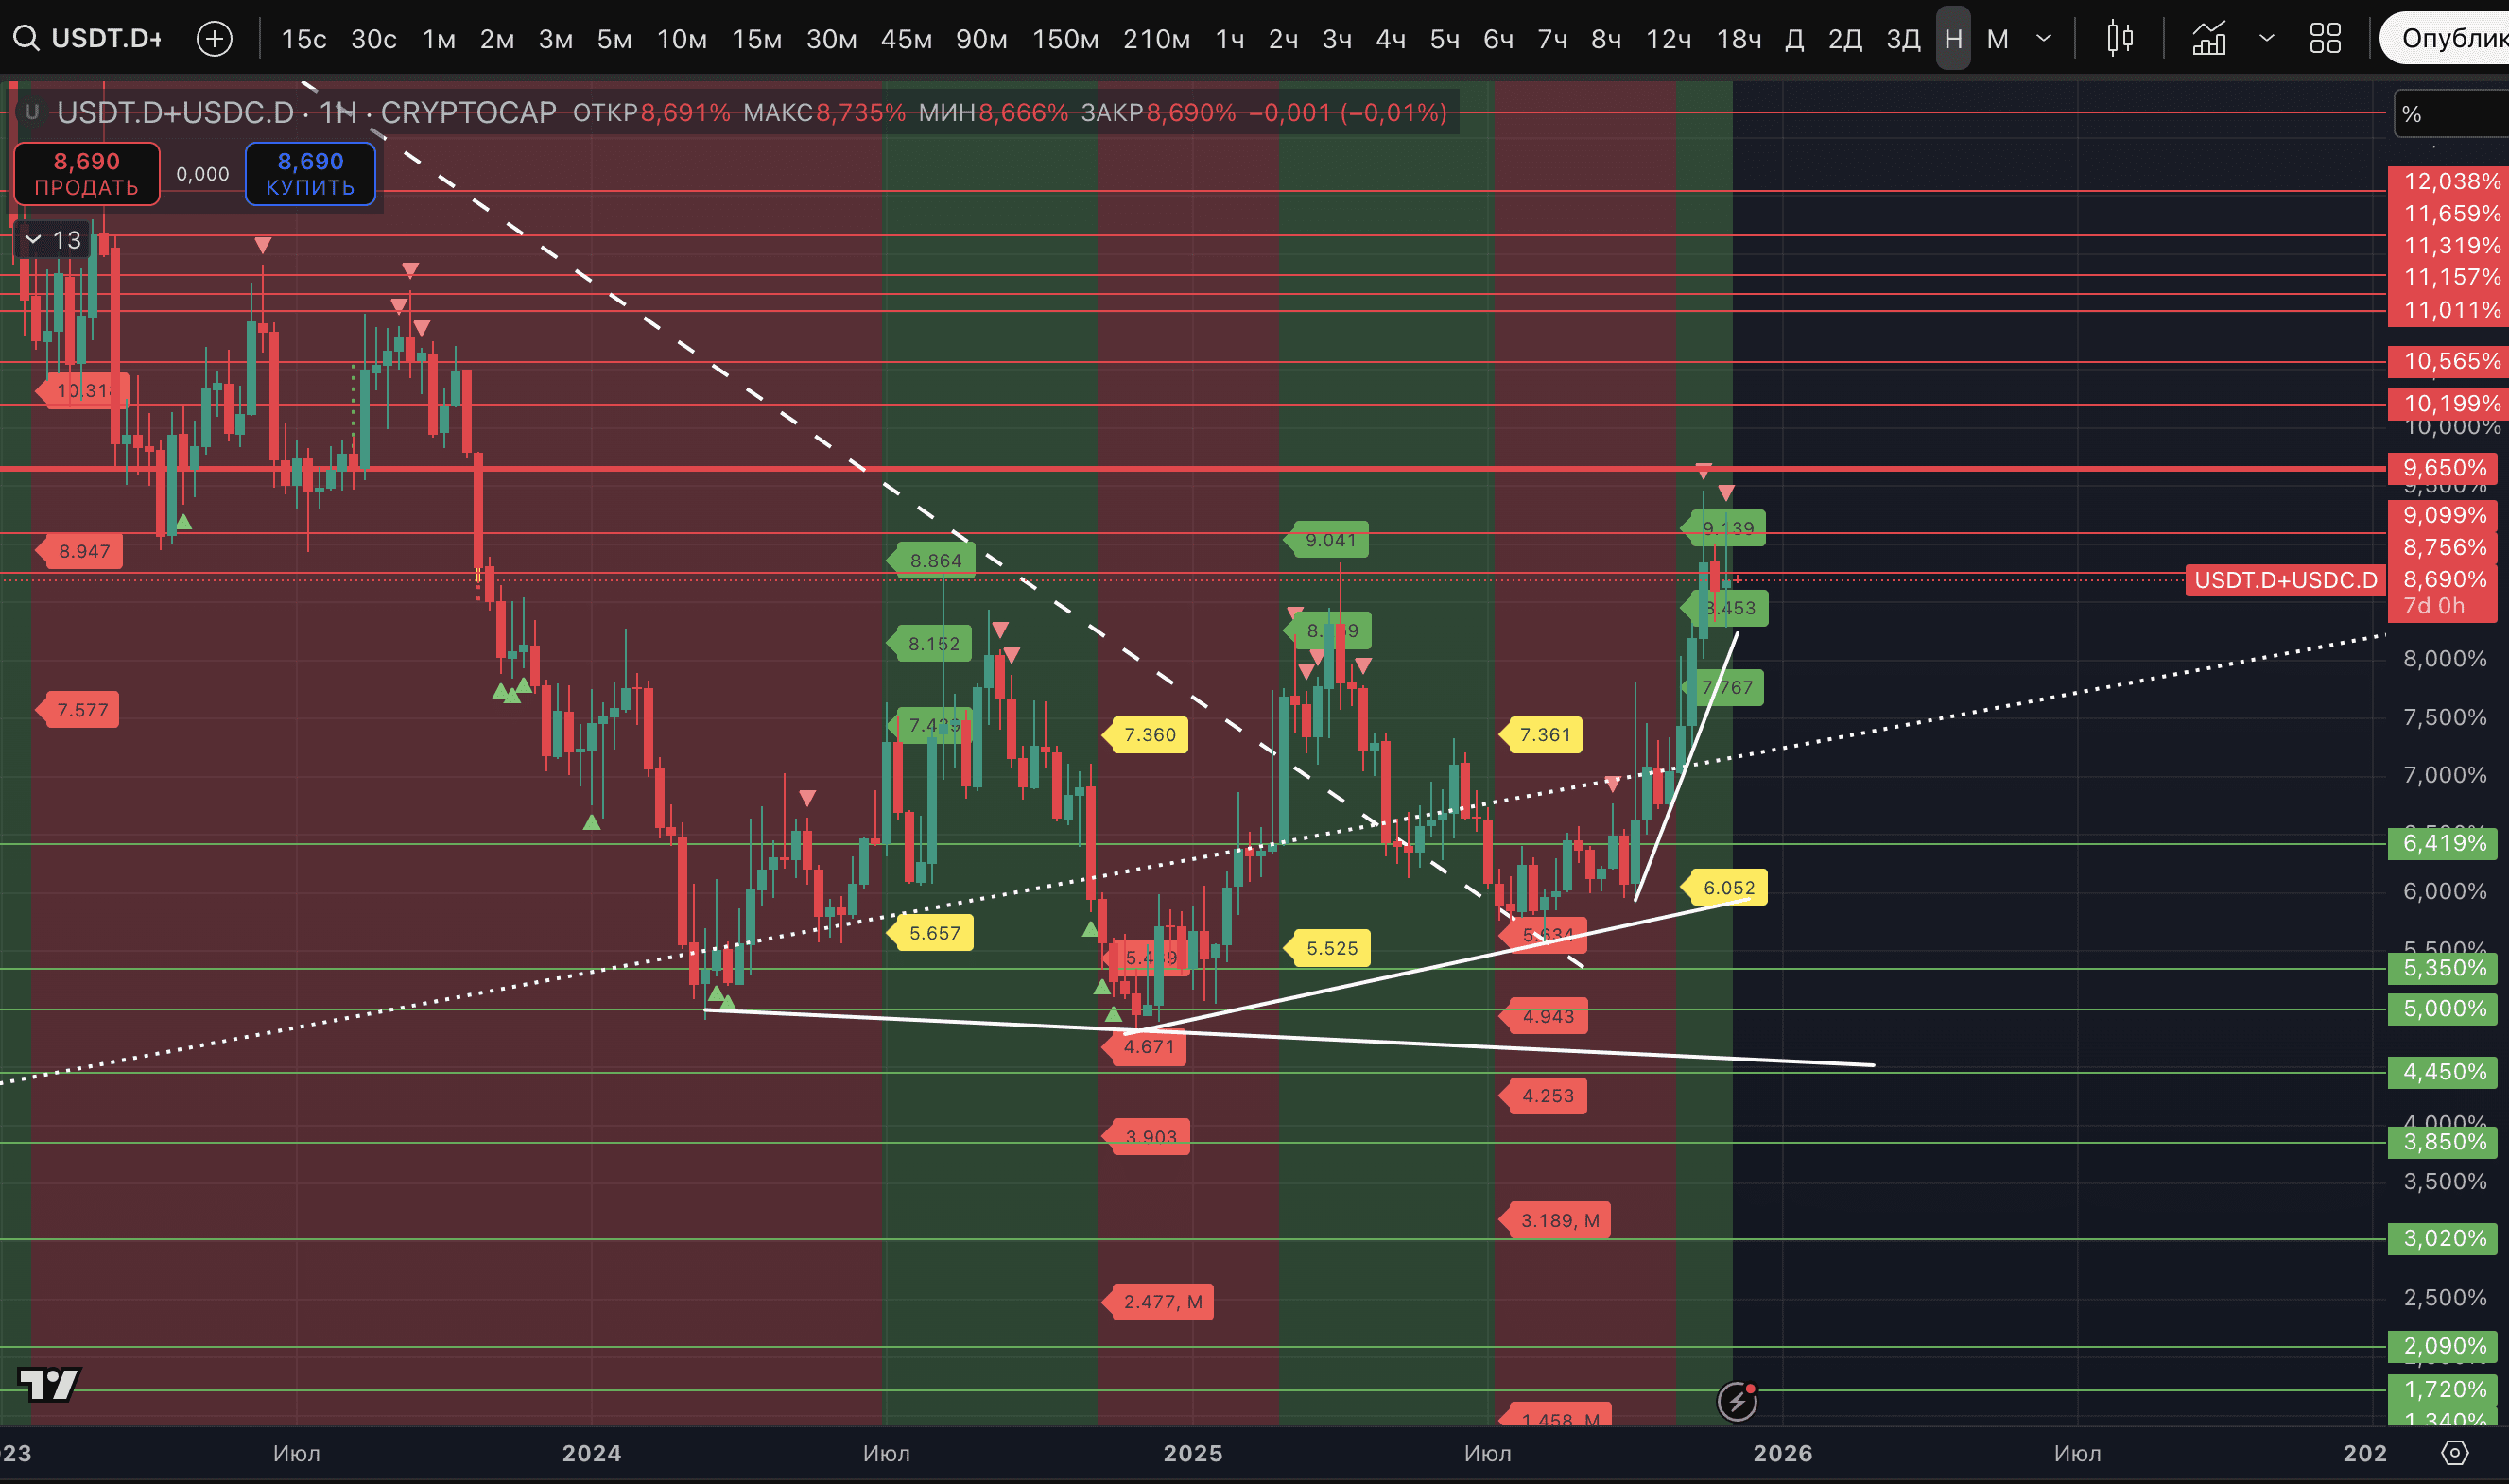
There are three high marks - in the capitalization chart of USDT+USDC. Moreover, let us remind you, there was a Strong signal on the 3-day timeframe, which is quite rare.
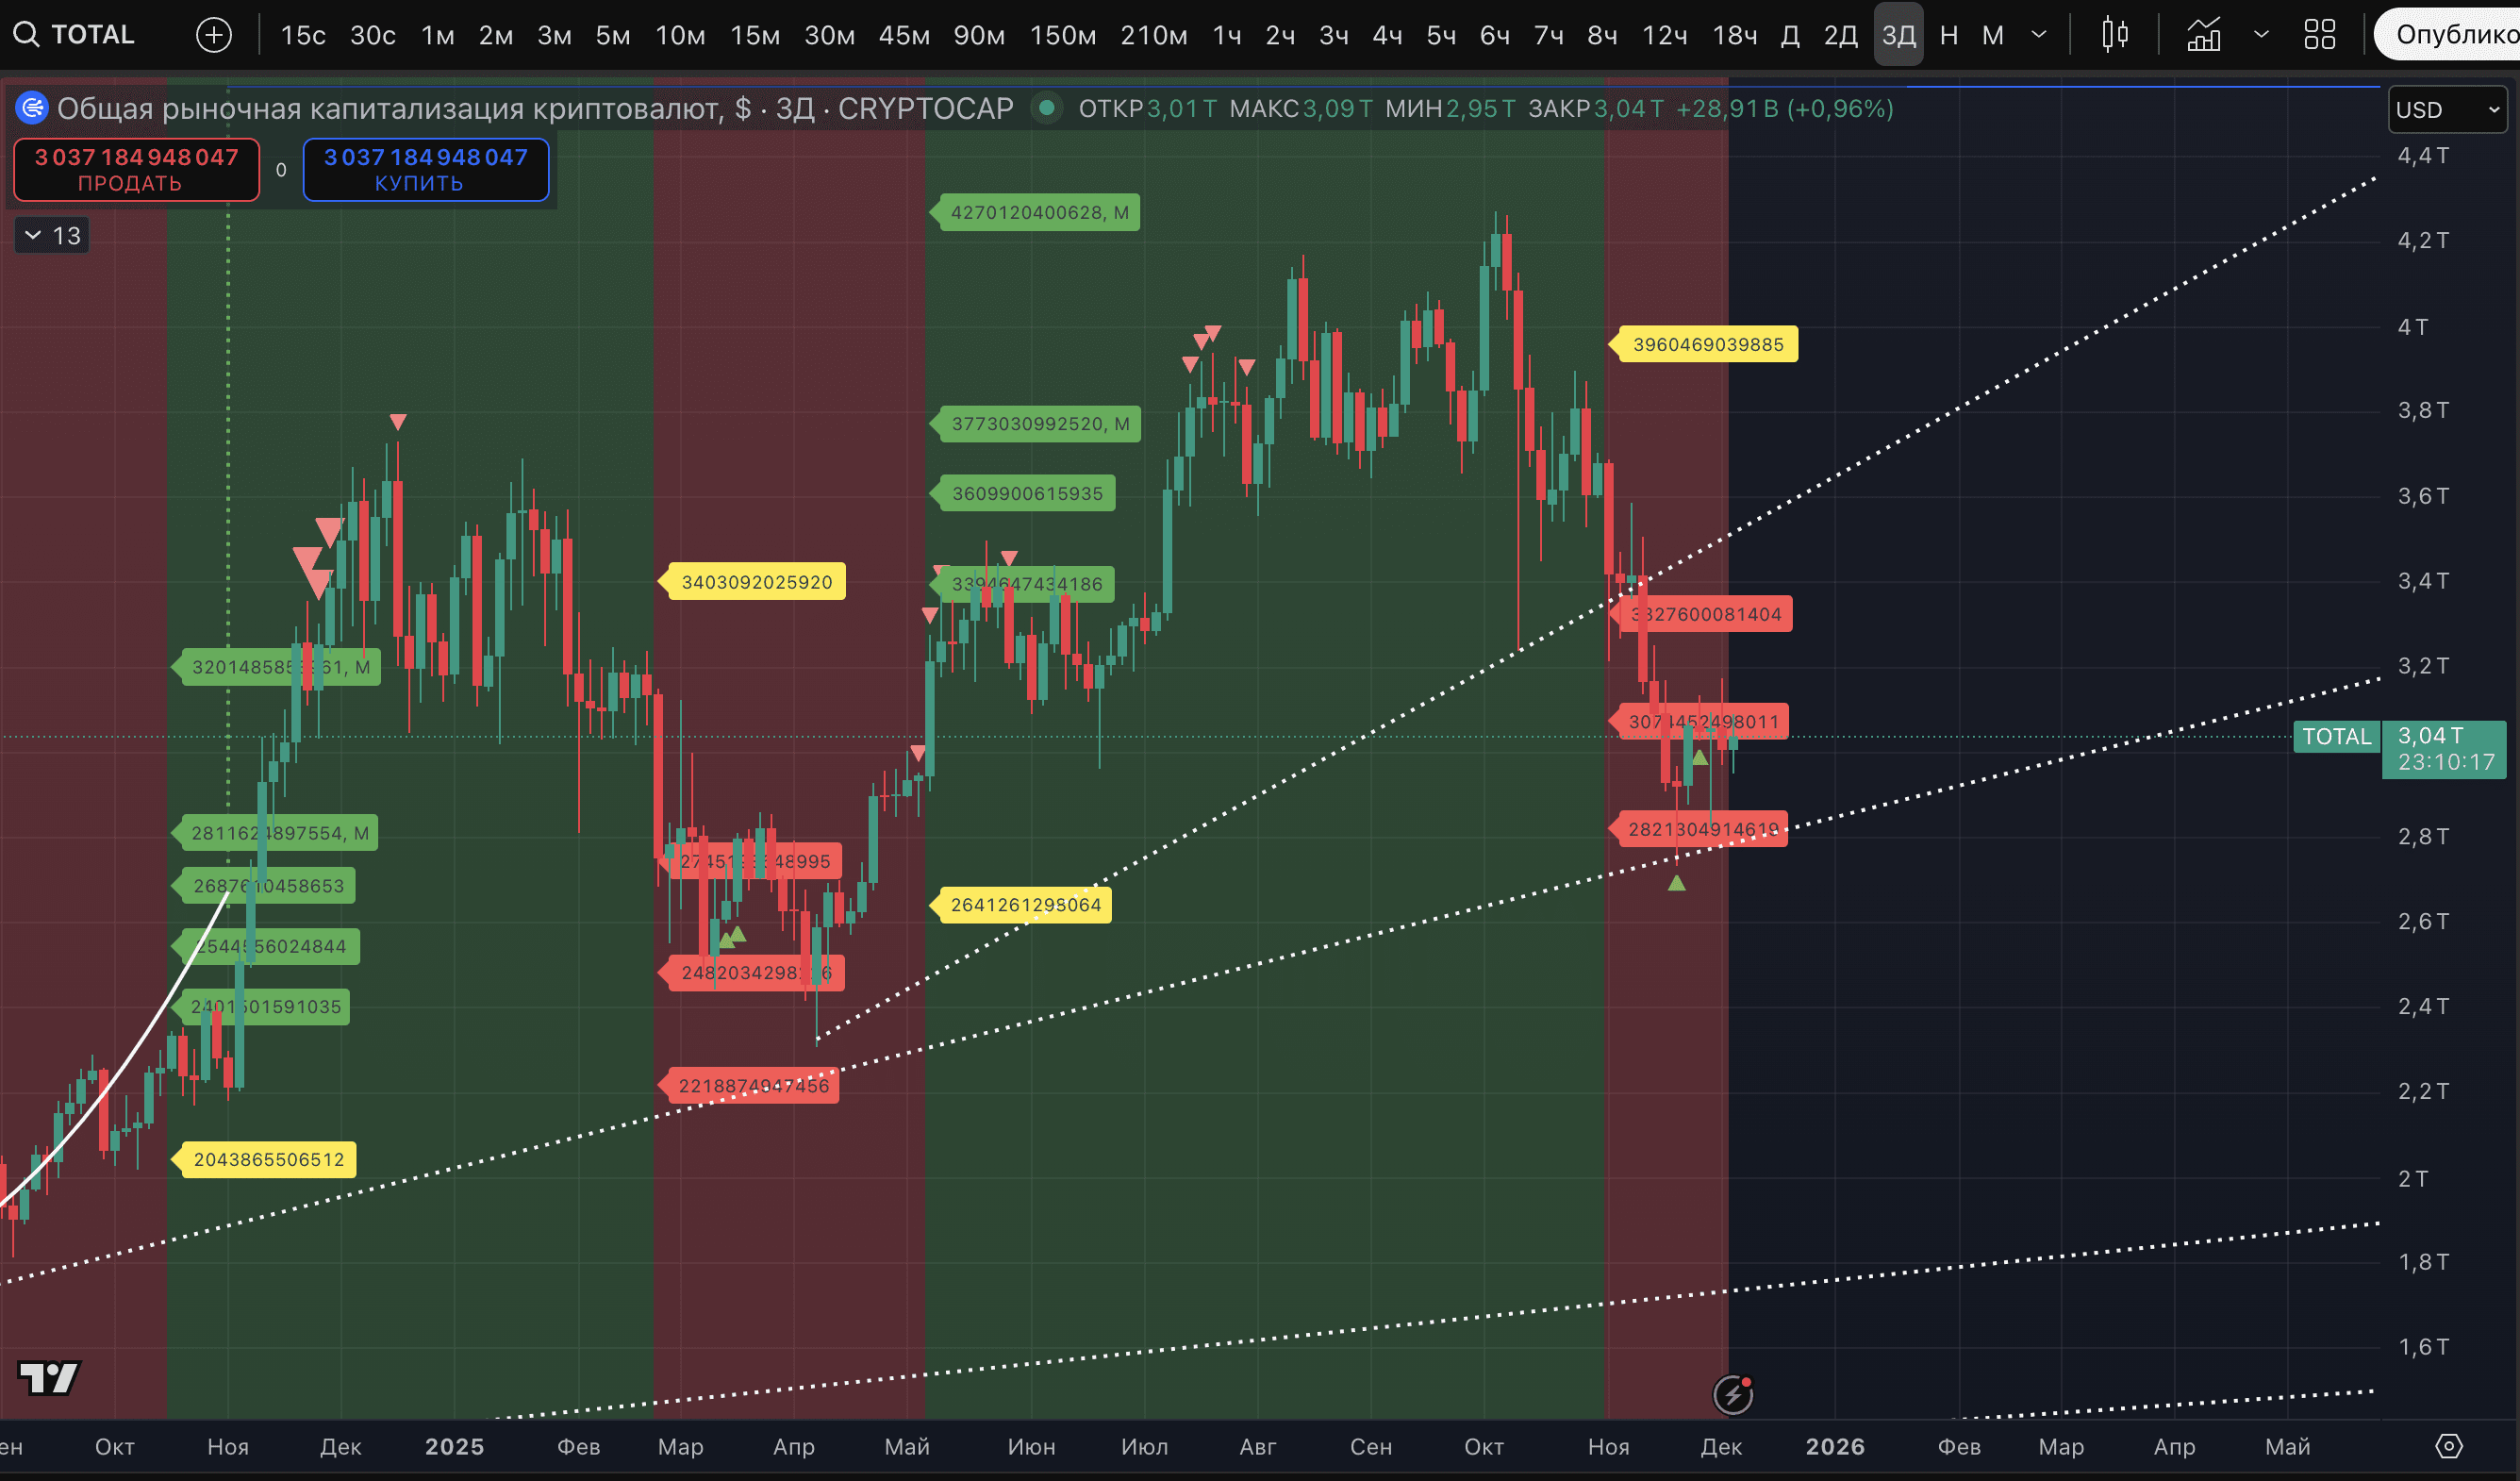
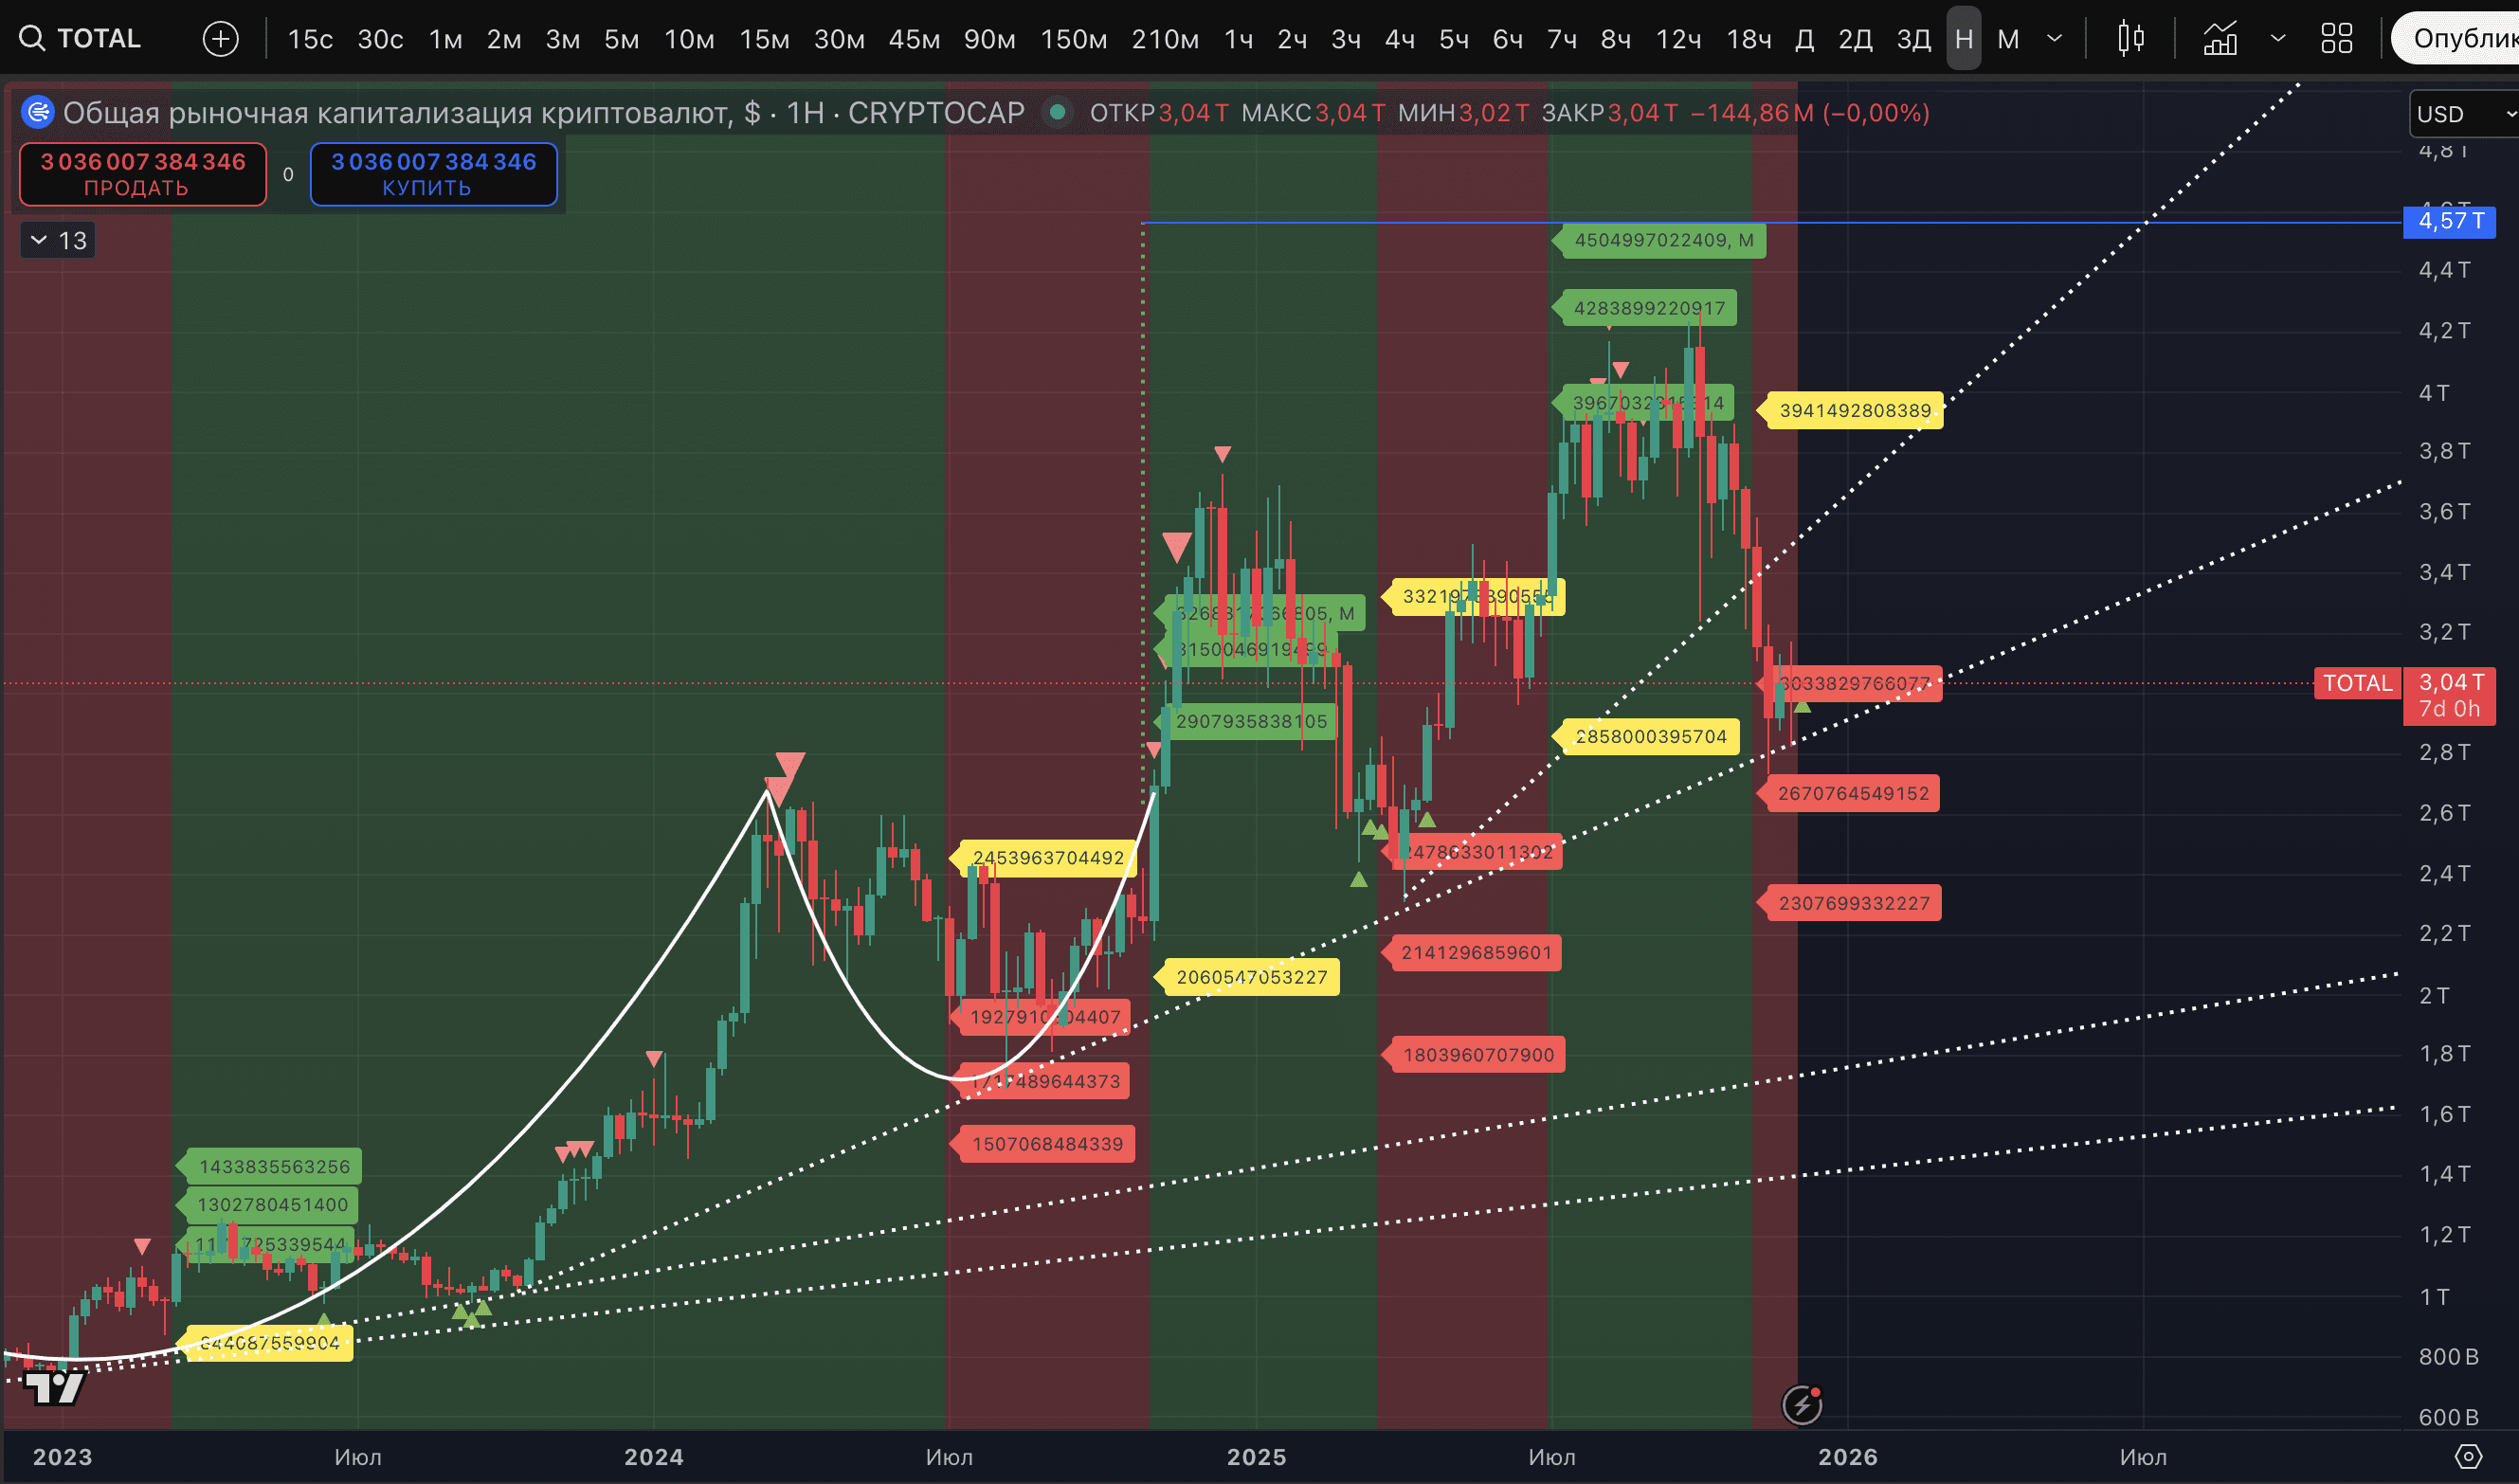
According to capitalization charts, it is easy to notice, for example, in which periods there were previously potential low marks on the TOTAL chart. This was in March-April 2025 and September 2023. In both cases, after that, the market began to soar. The current decline on TOTAL has, by the way, once again tested the 'neckline' of the previously worked out global pattern 'Cup with Handle'. Currently, TOTAL only has the first mark on the weekly timeframe. And TOTAL looks the least ready for a reversal compared to all capitalization charts.
TOTAL2 looks more 'on the edge' for a reversal. Here there are three potential low marks on the 3-day timeframe and three on the weekly. Meanwhile, the 'Cup with Handle' pattern here has broken, but the structure still has a decent chance for growth.
TOTAL3 - similarly, the 'Cup with Handle' pattern here was disrupted, but there are also three low marks on the 3-day and weekly timeframes. The most important thing is that this is the only metric in the cryptocurrency market capitalization that does not have a stable downtrend on the weekly timeframe. Buyers have maintained an uptrend. This metric is currently better prepared for a reversal than others. And let us remind you, this is the capitalization of the cryptocurrency market excluding #BTC and #ETH.
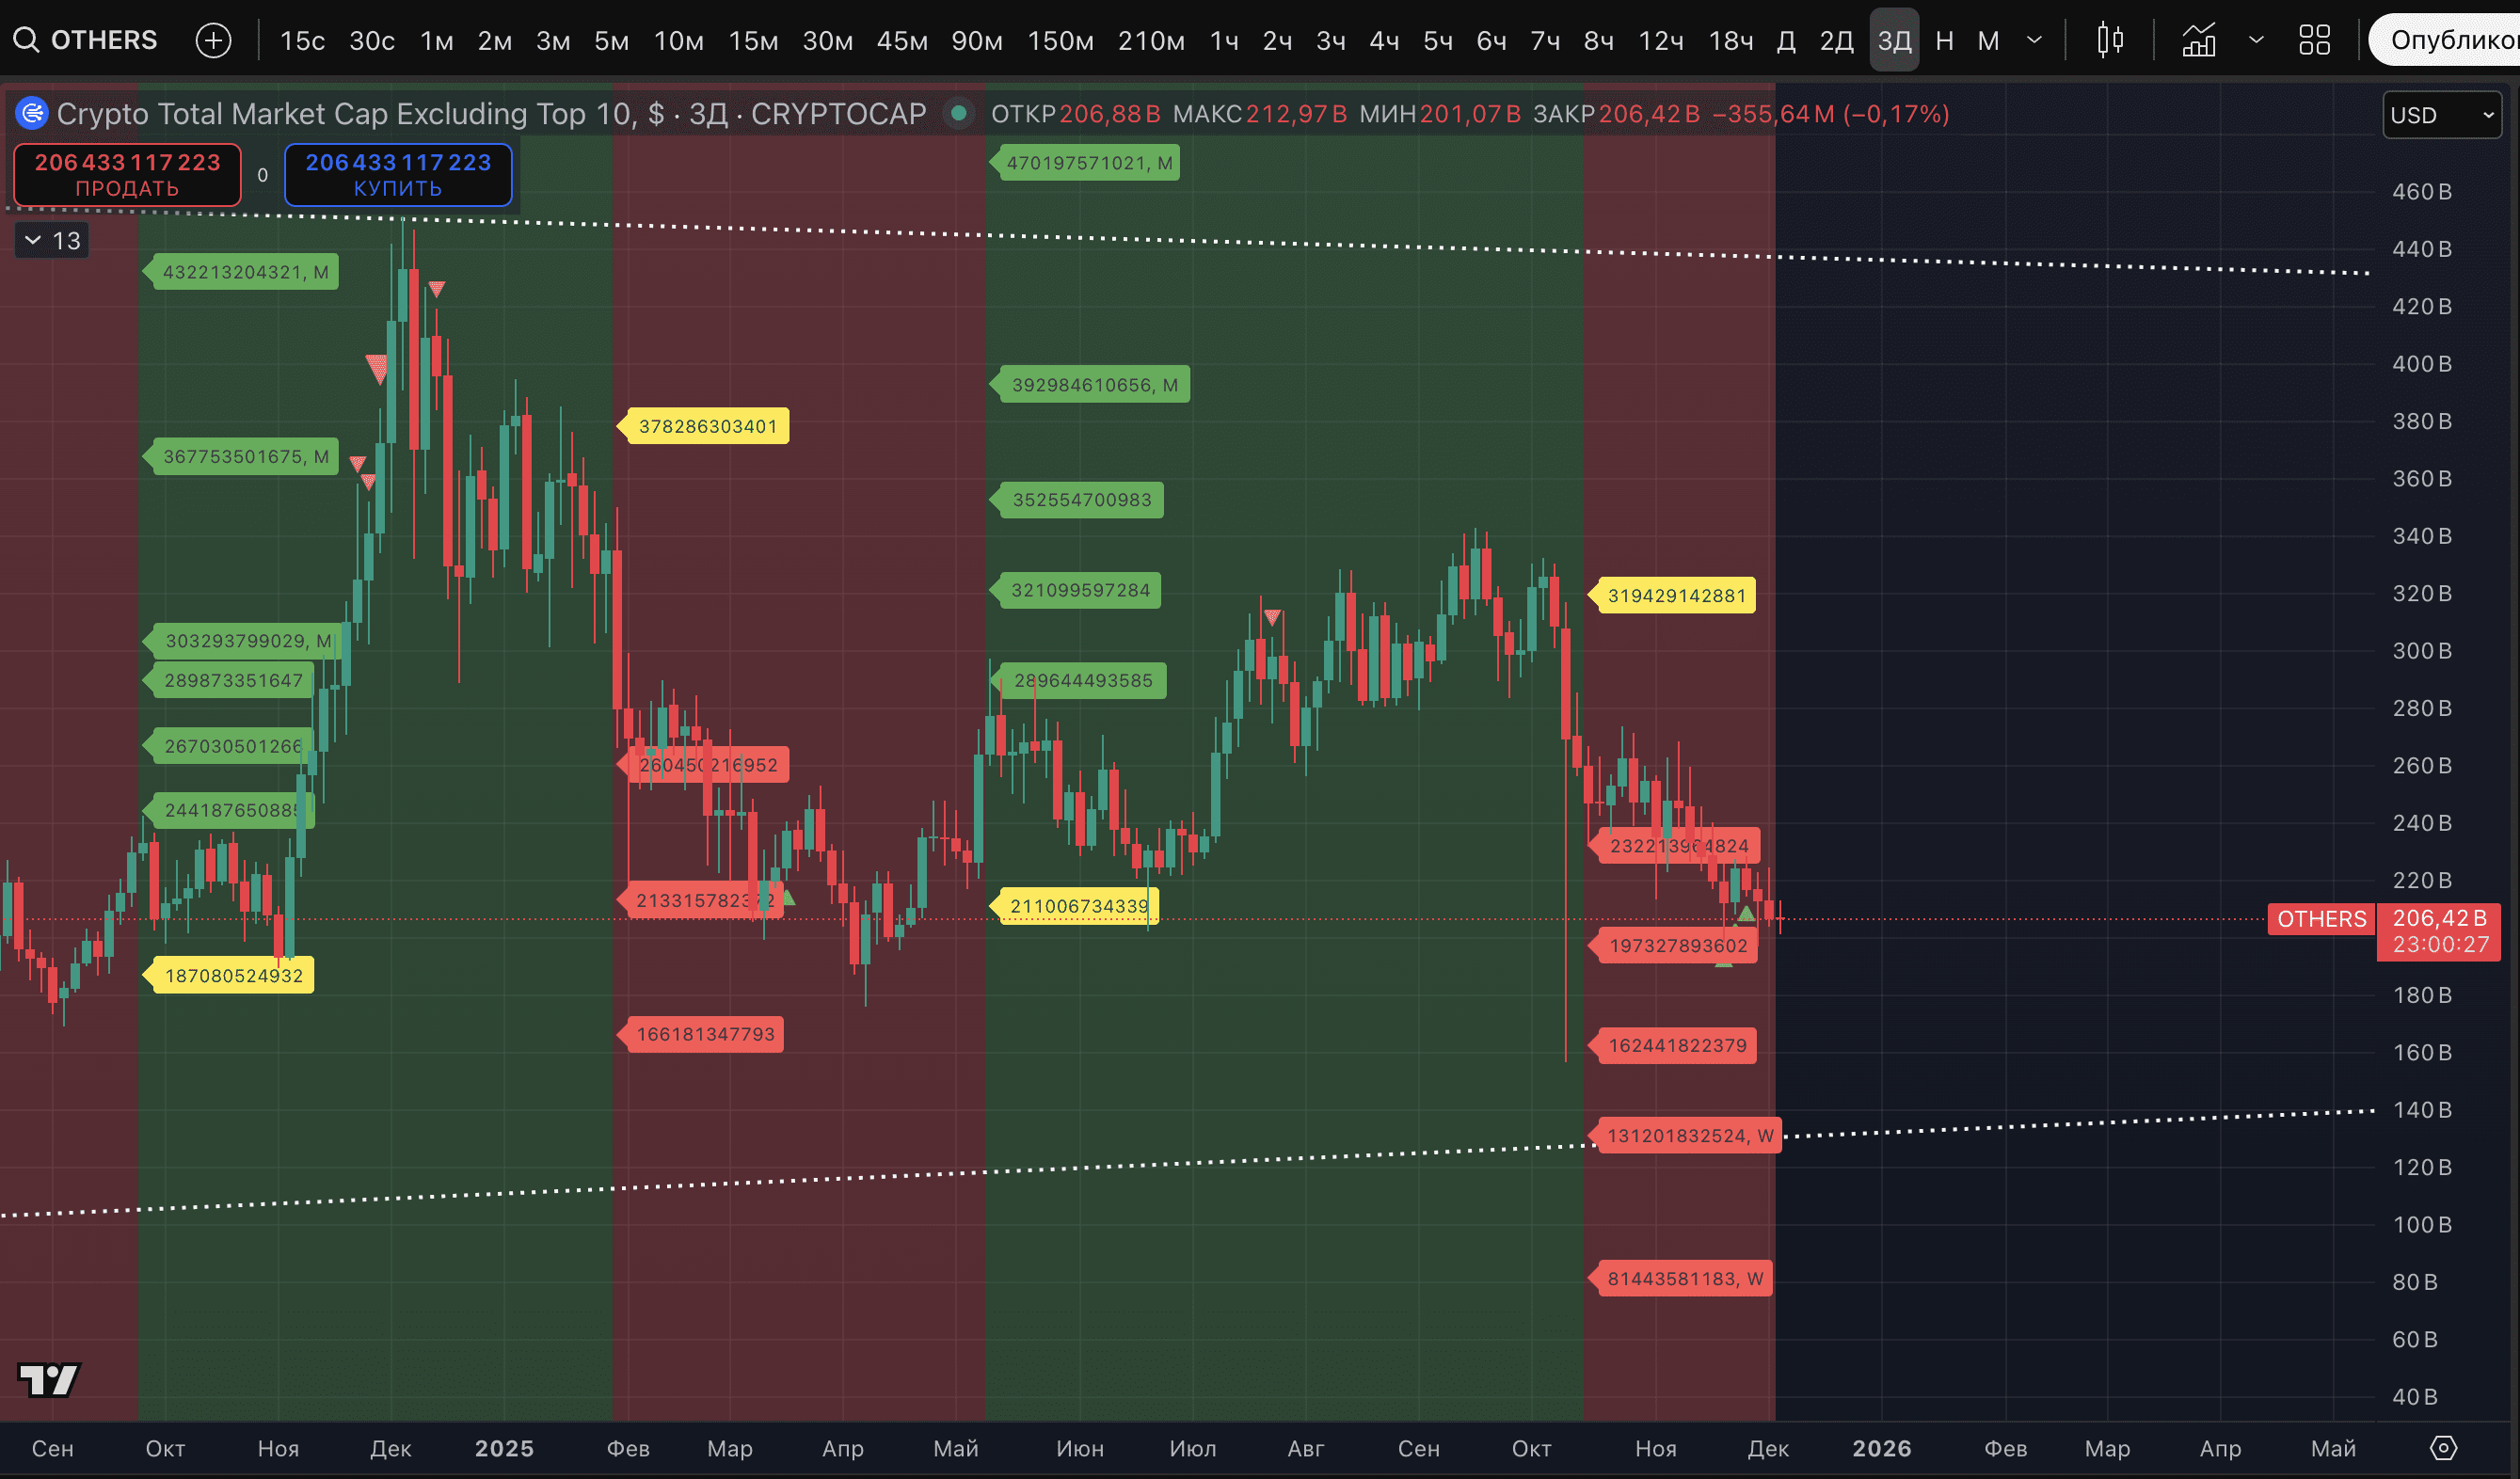
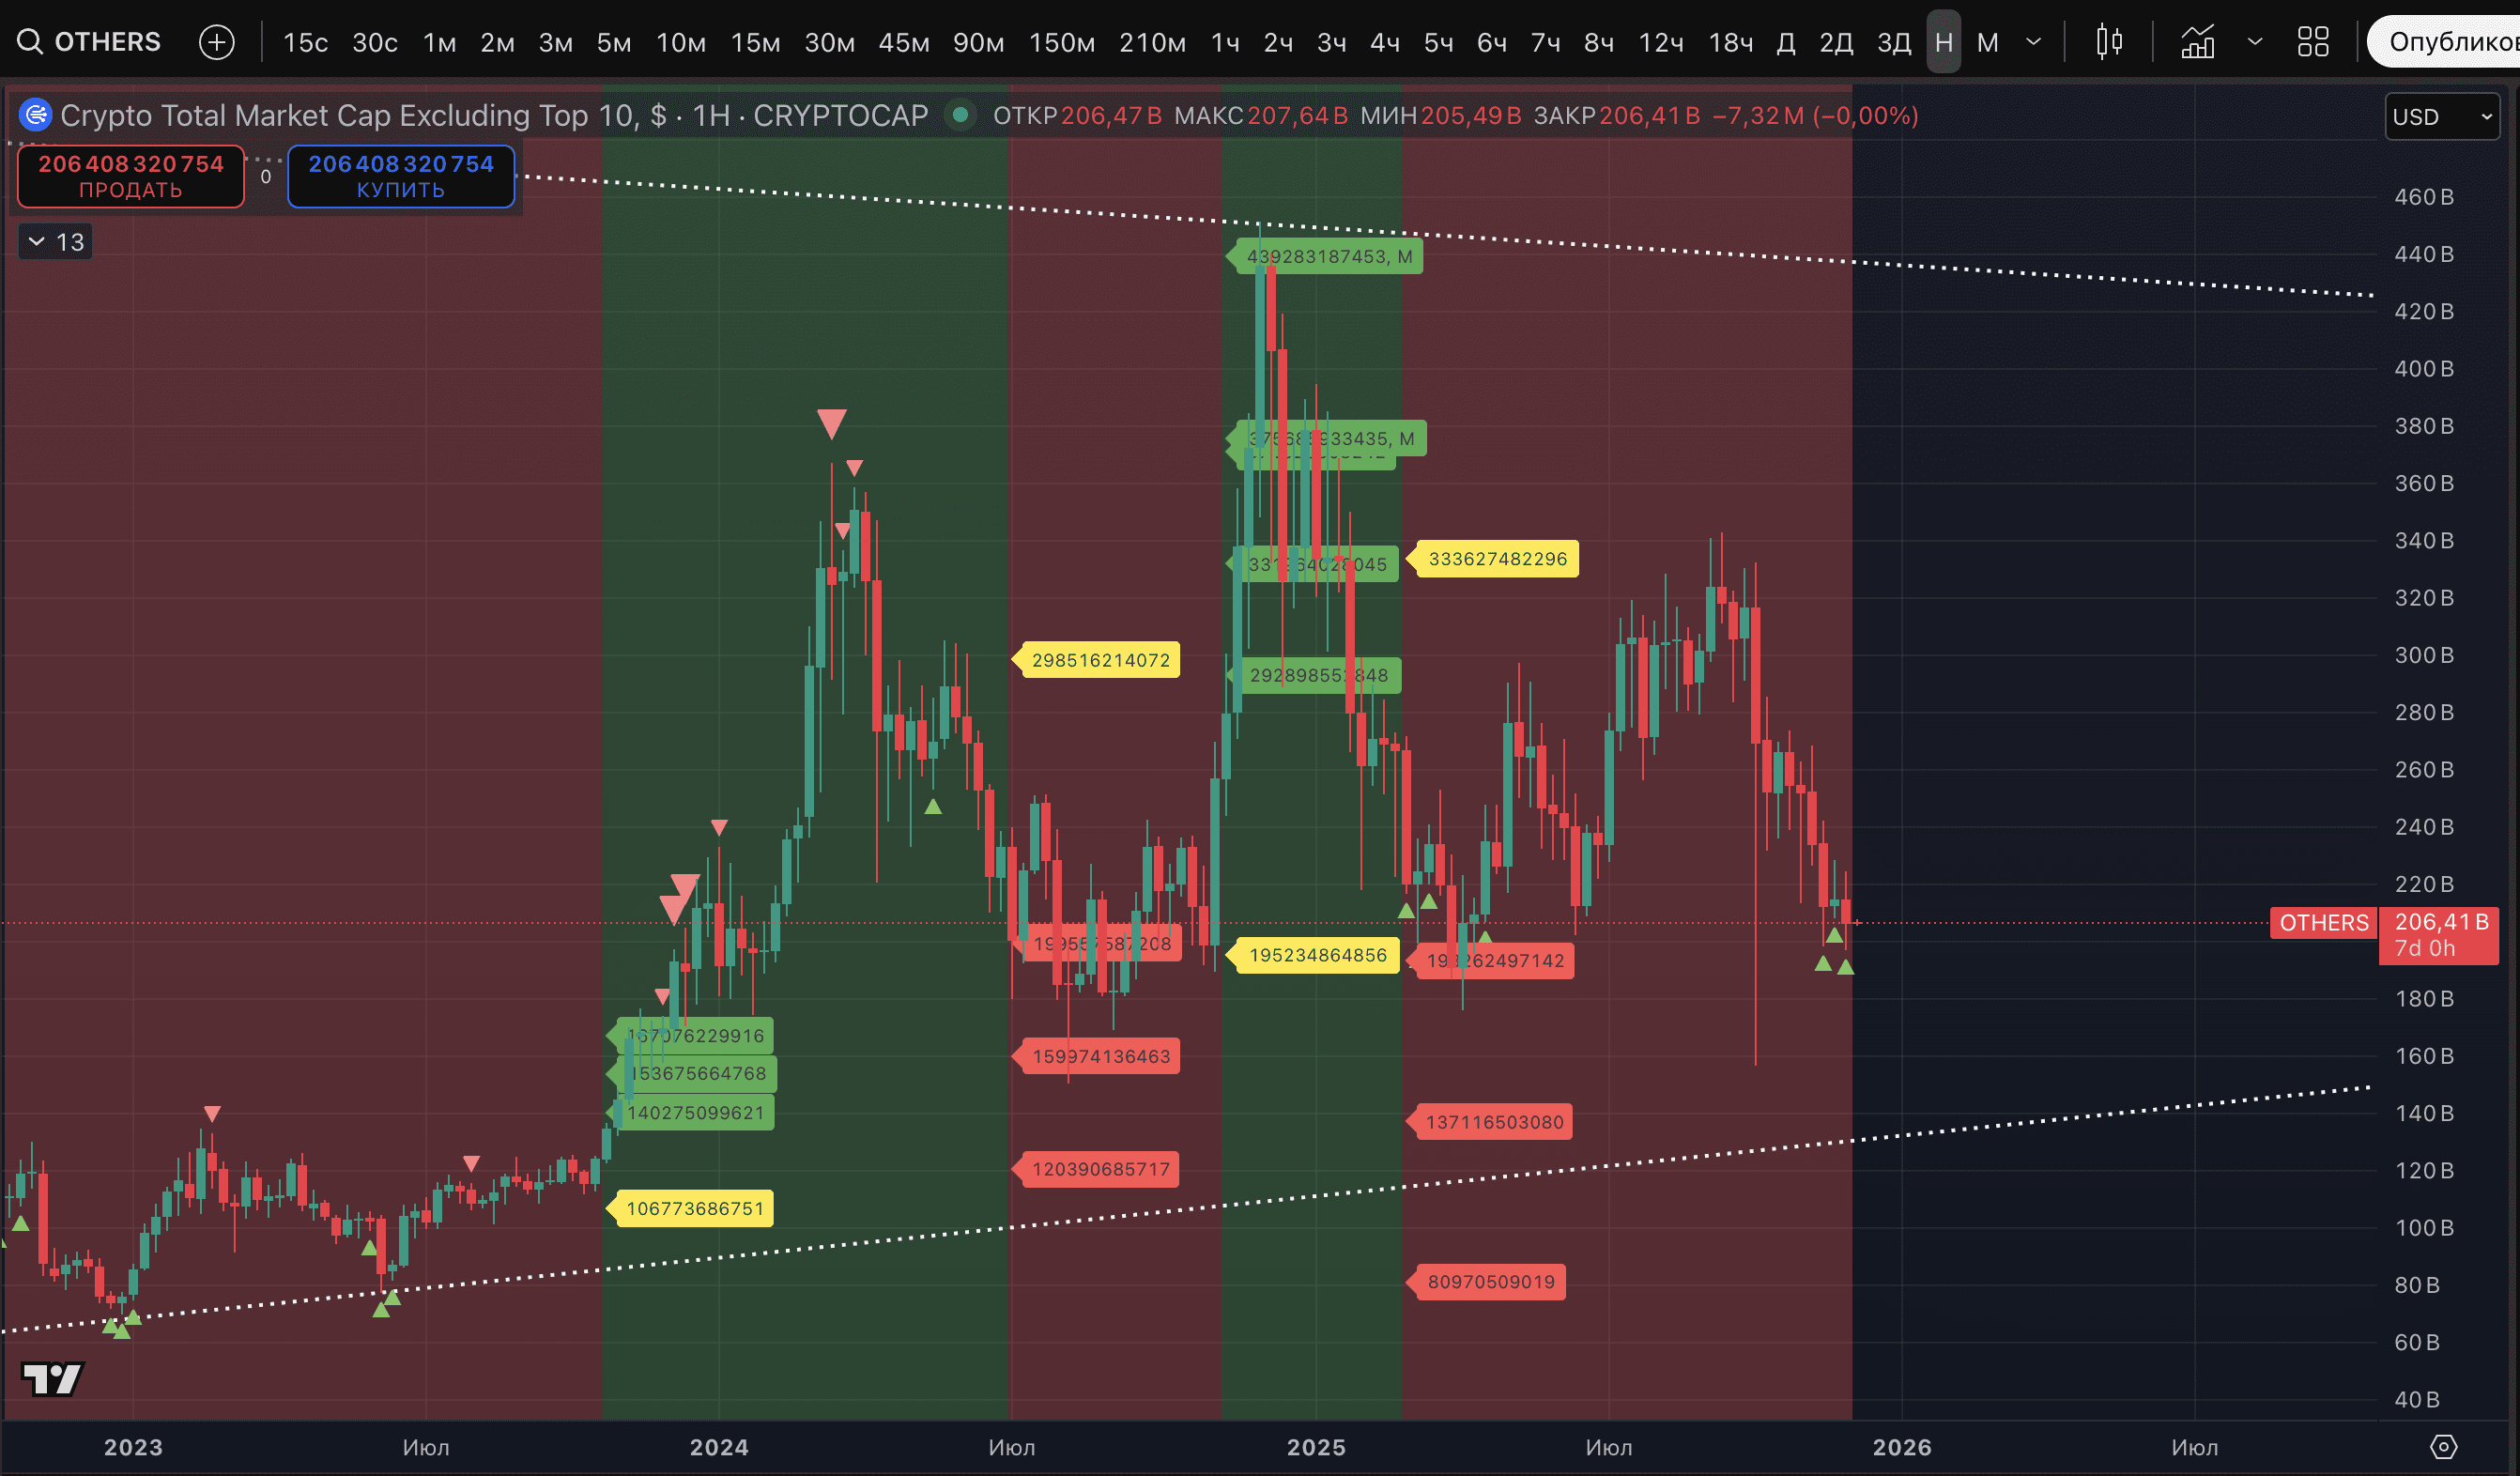
OTHERS - also three potential low marks on the 3-day and weekly timeframes. The chart shows that there were four such 'triples' on the weekly timeframe for the metric in this cycle, and now the fifth. In three cases, even after a slight re-low, such signals led to good growth.
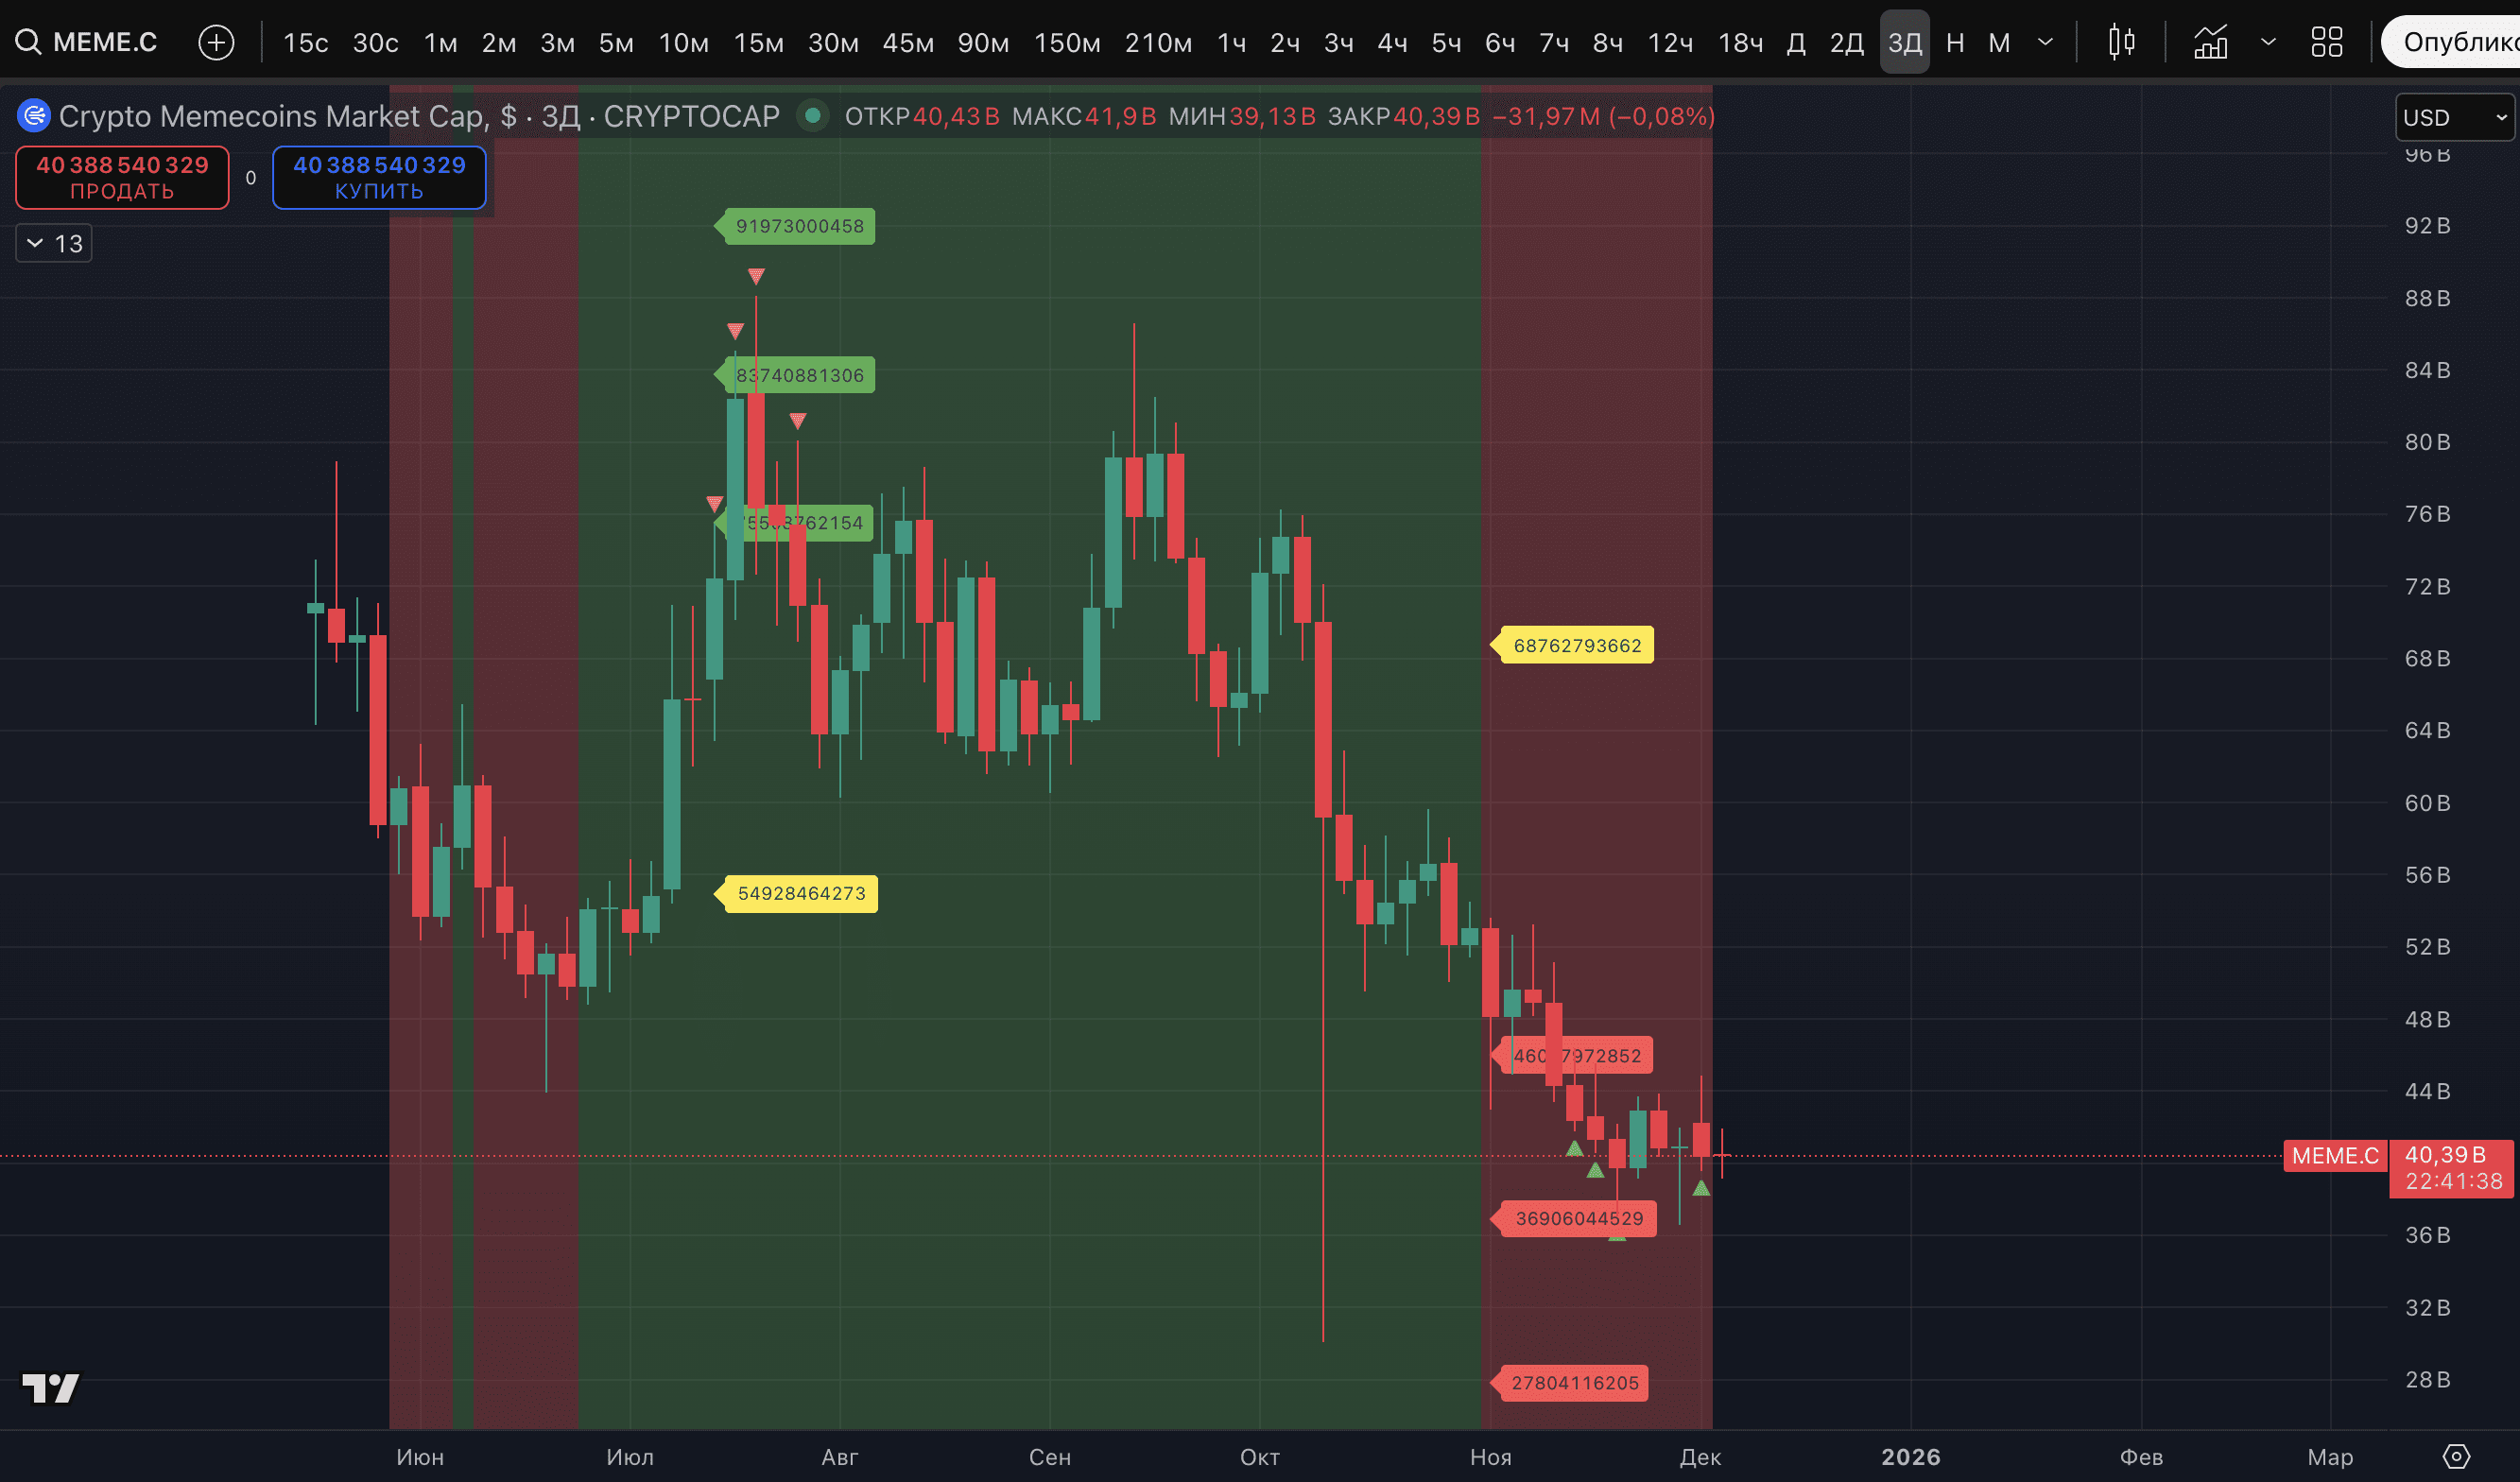
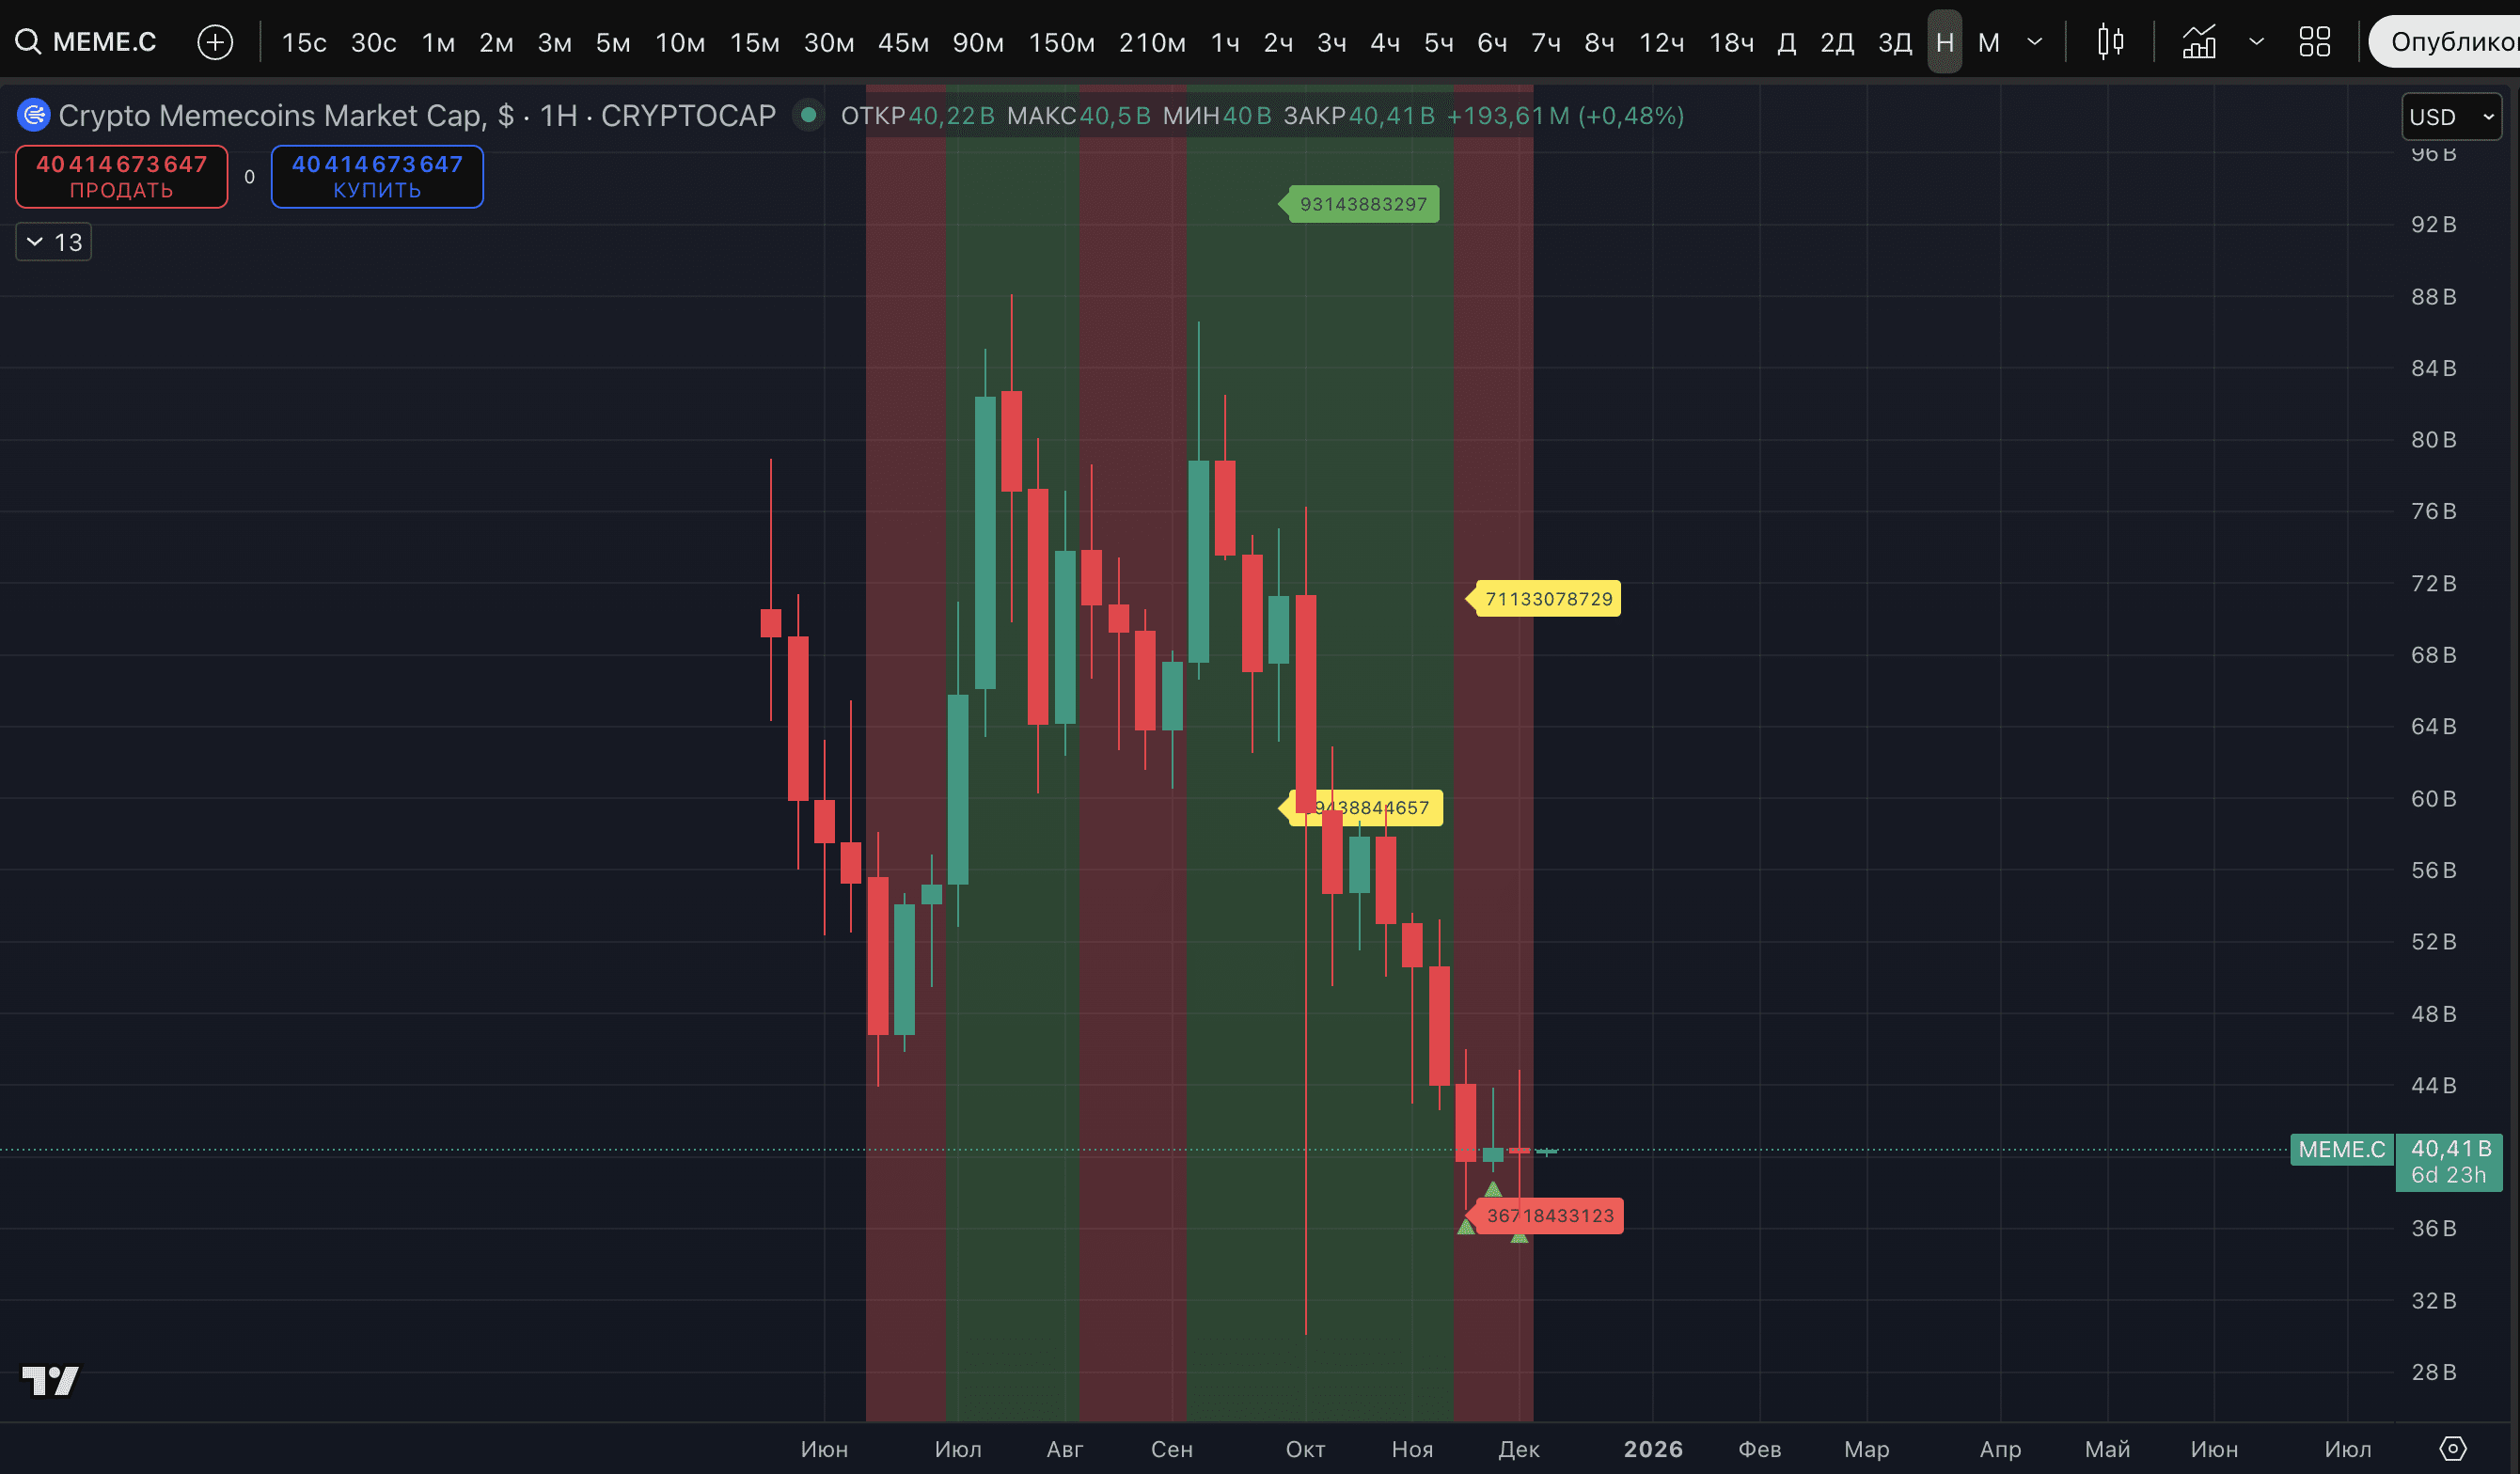
Also, let us remind you, MEME.C (capitalization of meme coins) has three low marks + a fourth additional one on the 3-day timeframe and three on the weekly timeframe.
VERY IMPORTANT WEEK AHEAD. Shorts without stops, we believe, are very dangerous.

