Key Insights
Current Price: $91,409 (as of December 8, 9:35 AM)
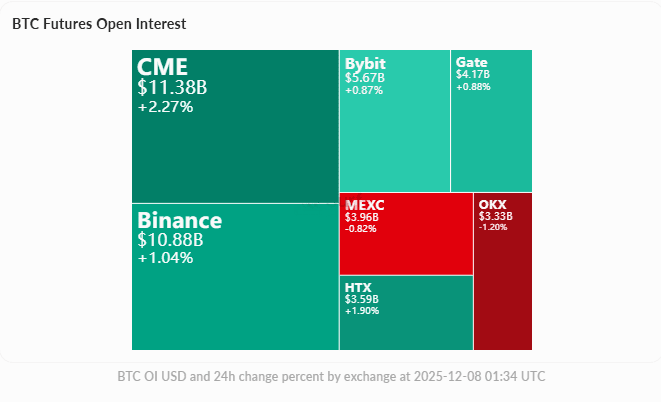
Short-term Outlook: Bullish. Short-term technical indicators show a buyer's advantage, with MACD forming a golden cross on the 1-hour and 4-hour charts, and prices stabilizing above multiple moving averages; the derivatives market's open interest increased by 2.17% to $57.69B over 24 hours, with major exchanges' funding rates turning negative (longs receiving), supporting further upward movement.
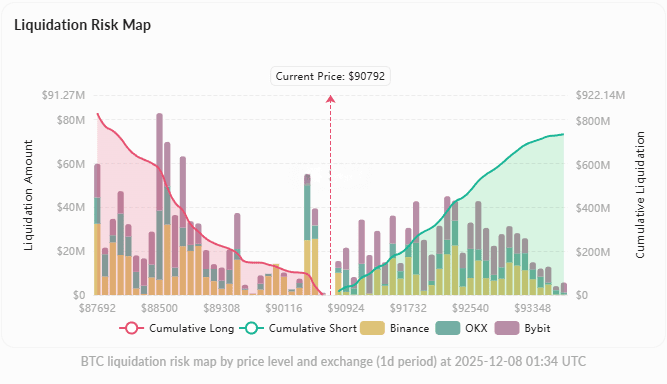
Key Support: $88,124 (1-hour Bollinger Band lower boundary), $88,182 (4-hour Bollinger Band lower boundary), $87,692 (cumulative long liquidation zone $838M)
Key Resistance: $91,801 (1-hour Bollinger Band upper boundary), $92,379 (4-hour Bollinger Band upper boundary), $90,823-$93,752 (cumulative short liquidation zone $741M)
Market dynamics
Price performance
In the past 24 hours, BTC rebounded from a low of $87,887 to a high of $91,673, with an increase of 4.31%. As of now, it is reported at $91,409, with a 24-hour increase of +2.03%. The price quickly recovered after testing support at $88,000 over the weekend, showing strong support below.
According to cross-validation of CoinMarketCap and CoinGecko data, the price fluctuates within the range of $90,400-$91,300, and the consistency of exchange aggregated data is good. The current price is above the middle track of the 4-hour Bollinger Band, with short-term bulls in favor.
Impact of macro events
The market is focusing on the Federal Reserve FOMC interest rate decision (expected to cut by 0.25%). Analysts expect BTC to strive for $100,000 after policy clarity. In addition, Twenty One Capital (holding 43,514 BTC worth about $4B) has received merger approval and will be listed on the New York Stock Exchange under the code XXI on December 9, with continuous positive releases from the institutional level.
Robinhood announced its entry into the Indonesian market through the acquisition of Buana Capital Sekuritas and Pedagang Aset Kripto (trade expected to be completed in the first half of 2026), expanding the coverage of cryptocurrency services.
Technical analysis
Multi-cycle indicator overview
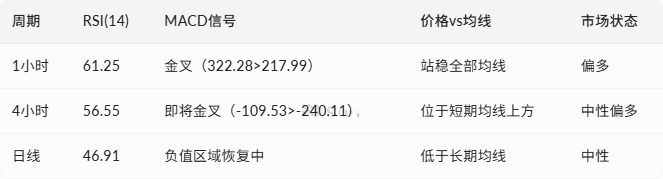
1-hour RSI is 61.25, not yet entering the overbought zone and still has upward space; 4-hour MACD histogram has turned from negative to positive, expanding to 130.58, showing a switch in momentum; although the daily MACD is still negative, the histogram continues to narrow, reflecting reduced selling pressure.
Moving average system
1 hour: Price $91,409 is above EMA(12) $90,416, EMA(26) $90,094, SMA(50) $89,714, SMA(200) $90,257, with a complete bullish arrangement.
4 hours: Price is above EMA(12) $90,297 and SMA(50) $90,306, but below SMA(200) $93,830; medium-term resistance still needs to be broken.
Daily: Price is below EMA(12) $90,582, EMA(26) $92,623, SMA(50) $98,818, in a long-term trend repair.
Support and resistance calculation
Upper resistance gradient:
First resistance: $91,801 (1-hour Bollinger Band upper track, +0.43% from current)
Second resistance: $92,379 (4-hour Bollinger Band upper track, +1.06% from current)
Strong resistance: $93,830 (4-hour SMA(200))
Lower support gradient:
First support: $90,280 (4-hour Bollinger Band middle track)
Second support: $88,124-$88,182 (overlap area of double cycle Bollinger Band lower track, -3.6% from current)
Strong support: $87,692 (liquidation concentration zone for large long positions)
Derivatives market
Total open interest $57.69B, increasing by 2.17% over 24 hours, indicating increased market participation. In terms of funding rates, Binance -0.000297 and Bybit -0.000827 are both negative (long position charging model), while OKX +0.000180 is slightly positive, overall leaning towards bullish expectations.
The liquidation risk chart shows that there is $838M of long positions accumulated below the current price of $87,692, which could trigger a chain liquidation if broken; above, the range of $90,823-$93,752 has accumulated short positions exposed at $741M, which could trigger a short squeeze after breaking.
On-chain and capital market
Exchange liquidity
On December 7, a net inflow of 3,214 BTC reversed the previous continuous outflow trend. Exchange reserves decreased from 2,799,048 BTC on November 24 to 2,766,171 BTC on December 7, with a cumulative outflow of 32,877 BTC, reflecting the willingness of long-term holders to increase positions.
Fear index
The Fear & Greed index remains at 21 (extreme fear), but prices have rebounded from the lows; historical data shows that extreme fear often corresponds to stage bottoms.
Community sentiment
Mainstream views
Twitter community sentiment shows a short-term cautious and long-term optimistic divergence. Recent price corrections and ETF fund outflows have caused short-term panic, but most analysts believe this is a technical adjustment caused by algorithm resets and insufficient liquidity, rather than a fundamental shift.
Influential figure Michael Saylor continues to advocate for BTC as a global reserve asset, predicting it will reach millions of dollars by 2045; analyst Maelius emphasizes that this cycle is different from history, with a well-structured high timeframe, expecting new highs in 2026.
Points of contention
Bearish: Pointing to continuous ETF outflows, rising Japanese bond yields causing macro risk, and the selling pressure from whales in a low liquidity environment.
Bullish: The rebuttal states that ETF outflows belong to institutional defensive rebalancing rather than a trend reversal signal. Historical data shows that after the stock market hits a new high, the probability of BTC not entering a bear market is high, and the increase in long-term holders' addresses on-chain confirms the logic of bottom consolidation.
Today's trading suggestions
Long zone: When retracing to the support zone of $88,500-$89,000 at the lower Bollinger Band, positions can be built in batches, with stop loss set at $87,500 (below the liquidation concentration zone).
Breakout buying: After effectively breaking through $92,379 (4-hour upper track), the target looks towards the $93,800-$94,200 daily Bollinger Band upper track area.
Risk warning: Market volatility intensifies before the FOMC decision, caution is needed regarding sharp fluctuations caused by interest rate expectation differences; intra-day focus on the two key defense lines of $88,182 and $92,379.

