Core viewpoints
Current price: $3,108 (as of December 8, 23:00)
Short-term outlook: Neutral to bullish. The technical indicators show a mixed pattern, with weakening momentum on the 1-hour level but bullish signals from the 4-hour and daily MACD. This is supported by the accumulation signal of a net outflow of 118,900 ETH on the chain, along with favorable news such as BlackRock's staking ETF application. If the key support level of $3,100 holds, the probability of reaching the target range of $3,150-$3,160 is about 60%; however, if it breaks below $3,094, there is a risk of a pullback to around $3,000.
Key support: $3,094 (1-hour Bollinger Band lower bound), $3,071 (4-hour Bollinger Band middle bound), $2,985 (4-hour Bollinger Band lower bound)
Key resistance: $3,129 (1-hour Bollinger Band middle line), $3,158 (4-hour Bollinger Band upper line), $3,225 (daily Bollinger Band upper line)
Technical analysis
Multi-cycle pattern assessment
The hourly level shows short-term adjustment signals. RSI is in the neutral zone at 47.97, and the MACD shows a bearish crossover (MACD line 6.44 below the signal line 10.45), with the price near the lower Bollinger Band ($3,094 support), indicating weakened short-term momentum. Although the price is below the 12 and 26-period EMAs, it remains above the 50-period SMA ($3,090), showing that the bullish defense line has not completely failed.
The 4-hour level maintains an upward trend. RSI has risen to 53.35, slightly bullish, and MACD shows a bullish pattern (MACD line 16.56 above the signal line 12.98, histogram +3.57). The price is stable above the 12-period EMA ($3,101), 26-period EMA ($3,084), and 50-period SMA ($3,038), confirming a short- to mid-term upward structure. The current price is between the middle Bollinger Band ($3,071) and the upper band ($3,158), testing the resistance of the 200-period SMA ($3,112) above.
The daily level shows potential reversal signs. RSI hovers around the neutral line at 49.39, and the MACD is beginning to turn bullish (MACD line -55.18 crossing above the signal line -98.83, histogram +43.65), indicating a possible bounce from recent lows. The price broke through the 12-period EMA ($3,057) but is constrained by the 26-period EMA ($3,112), with long-term moving averages like the 50-period SMA ($3,337) and 200-period SMA ($3,545) still posing significant upward resistance. OBV is at -6.86 million, suggesting that underlying capital distribution pressure remains.
Derivatives market dynamics
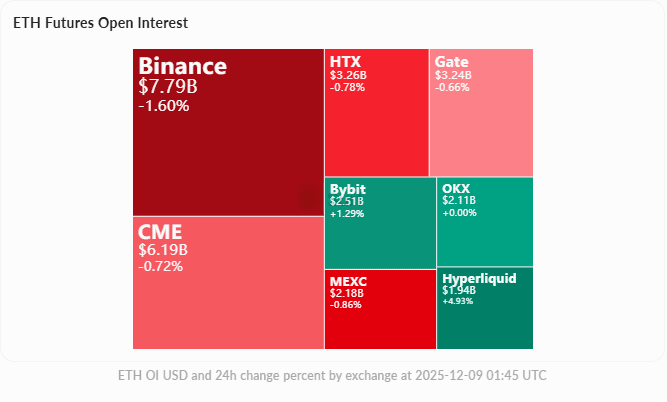
The total futures open interest is $37.38 billion, decreasing 0.61% over 24 hours and down 1.3% over 4 hours, reflecting a deleveraging trend and bullish-bearish wait-and-see sentiment. Most funding rates are positive (Binance 0.0072%, Bybit 0.0071%), with bulls needing to pay funding fees to bears every 8 hours, which may suppress further upward momentum.
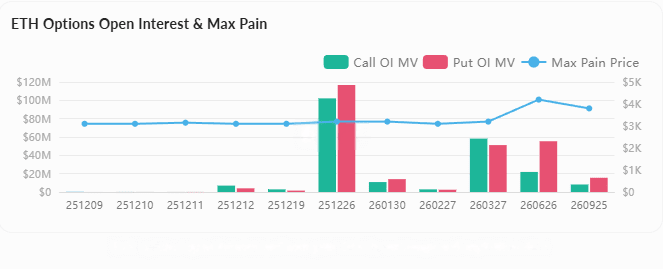
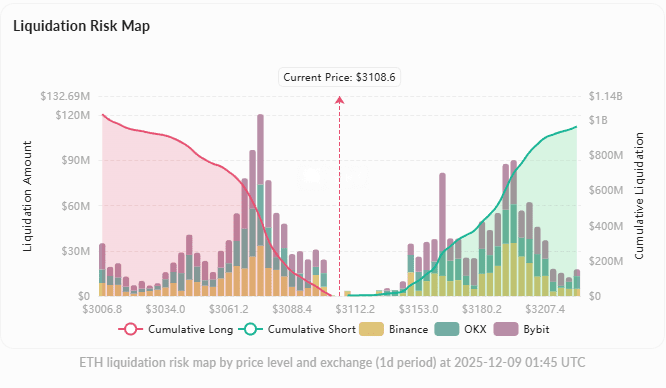
The 24-hour liquidation amount reached $51.35 million, with short liquidations of $29.77 million exceeding long liquidations of $21.58 million, confirming a bullish liquidation bias. The options open interest is $10.89 billion (up 0.46%), with Deribit accounting for 68.59%, and trading volume surged by 34.44%, focusing on the $3,100 major pain point. The liquidation heatmap shows a cumulative long exposure of $1.03 billion at $3,007, with a downward chain liquidation risk; above, there is only a small short liquidation resistance of $3.36 million between $3,109 and $3,112.
Key price strategy
If the price holds above $3,100 (the major pain point/psychological support), combined with the bullish signals from the 4-hour and daily MACD, it is expected to challenge the $3,150-$3,160 range (near the upper Bollinger Band on the 4-hour chart), with further upward targets at $3,225 (daily upper Bollinger Band) and $3,337 (daily 50-period SMA). The downside risk is that if it falls below $3,094 (the lower Bollinger Band on the hourly chart), it might trigger a correction to $3,000-$3,007 (Bollinger Band lower band/liquidation cluster area), and subsequently test the strong support level at $2,985.
On-chain data analysis
Exchange fund flow
On December 8, ETH showed a net outflow of 118,900 from exchanges, an obvious accumulation signal, with an inflow of 612,000 and an outflow of 730,800 that day, significantly larger than the previous day's (December 7 net outflow of only 3,480). The exchange reserves decreased from 16.66 million on December 7 to 16.54 million on December 8 (with a value drop from $50.59 billion to $50.52 billion), reducing withdrawals to self-custody or institutional wallets and lowering selling pressure risks.
Whale movements and institutional accumulation
At the institutional level, BitMine (led by Tom Lee) has increased its holdings by 138,500 ETH (worth $435 million), bringing its total holdings to 3.86 million ETH (accounting for 3.2% of the circulating supply), valued at $13.2 billion, demonstrating long-term bullish confidence. BlackRock holds 3.94 million ETH, ranking among the industry's leaders. On-chain whales have opened a total of $426 million in new long positions: 1011short (54,300 ETH, $169 million), Anti-CZ (62,200 ETH, $194 million), pension-usdt.eth (20,000 ETH, $62.5 million), and 0xBADBB ($189.5 million), betting on the price breaking into the $4,000 region.
An individual whale deposited 5,000 ETH ($15.5 million) into Binance on December 8, continuing the action of transferring a total of 30,600 ETH ($101 million) to Binance and Galaxy Digital since October 28. The wallet still holds 5,000 ETH, possibly preparing for cashing out but not constituting dominant selling pressure. Additionally, 57,600 ETH ($178.6 million) were transferred between unknown wallets, suspected to be internal adjustments rather than circulating distributions.
Accumulation pattern judgment
Overall, the net outflow from exchanges, large institutional purchases, and derivatives whales going long show a net accumulation trend. The selling pressure is concentrated on small amounts of coins held by individual whales, far lower than the buying power of BitMine's single $435 million and the long positions of $426 million. On December 8, the price maintained above $3,100 throughout the day (with a daily high of $3,171 and a low of $3,097), and if it breaks through the resistance at $3,250, it could form an ascending triangle targeting $4,020. Coupled with institutional purchases and bullish whales, the potential upward space is 20-28%.
Market sentiment analysis
Core bullish narrative
BlackRock's ETH ETF staking application has become a market focus, proposing a product under the code ETHB that stakes 70-90% of its holdings through custodians (such as Coinbase), distributing staking rewards quarterly to provide compliant income channels for traditional investors. This move marks a shift in regulatory attitude, with the new SEC leadership allowing embedded staking functions in ETFs, breaking previous restrictions and deepening the integration of traditional finance and the crypto market. The community generally views this as a major bullish catalyst, with accounts like Cointelegraph and CryptoRover emphasizing increased institutional participation.
Technical indicators and the relative strength of ETH/BTC have sparked optimistic expectations among traders. MerlijnTrader, Sykodelic_, and others point out that the ETH/BTC chart has reclaimed key moving averages, stabilizing above the 20-day moving average for the first time in three months, suggesting that ETH may outperform BTC and initiate altcoin rallies. sassal0x has refuted the criticisms of ETH, which are becoming increasingly marginalized, while sassal and the community emphasize improving fundamentals.
Social media sentiment
The r/ethtrader section on Reddit actively shares news about BlackRock, with users focusing on short-term fluctuations while maintaining a long-term holding stance. Discussions on Twitter/X exhibit a strong positive tone, with topics dominated by institutional progress, income-generating product innovations, and bullish technical signals, while bearish viewpoints are almost absent or countered. The community framework emphasizes ETH's role in mainstream finance, with excitement surrounding product innovations and technological breakthroughs potentially driving short-term upward momentum.
Regulatory and liquidity environment
On December 8, the CFTC launched a digital asset pilot program allowing BTC, ETH, and USDC to be used as collateral in the U.S. derivatives market (accompanied by reports and custody rules), further broadening ETH's application scenarios. The net inflow of ETH reached $512.38 million, combined with positive regulatory signals and institutional allocation demand, supporting the price to break above $3,000, with an intraday increase of 5.48% (U.Today data). Under the expectation of liquidity easing, the improvement in capital helps ETH and altcoin performance.
Summary
On December 8, ETH closed at $3,108, with a slight drop of 0.33% over 24 hours but a weekly increase of 11.05%. The technical aspect shows a bullish bias amidst divergence. The MACD on the hourly level is bearish, but the 4-hour and daily charts have turned bullish. The price holds above the $3,100 support and tests the $3,129-$3,158 resistance range. On-chain data shows a net outflow of 118,900 ETH from exchanges, with institutions increasing their holdings by $435 million and whales adding $426 million long, indicating clear accumulation signals. BlackRock's ETF application for staking and CFTC regulatory pilot initiatives have boosted social sentiment, dominating the bullish narrative.
The derivatives market shows signs of deleveraging (positions down 0.61%) but with short liquidations dominating, with options focusing on the $3,100 major pain point. The funding rate is positive or limits short-term gains. If it holds the $3,100 support, the target is the $3,150-$3,160 range (60% probability), with further challenges at $3,225-$3,337; if it fails to hold $3,094, there is a risk of a pullback to $3,000-$3,007 (40% probability). Overall, on-chain accumulation, institutional layouts, and social optimistic sentiment provide support for bulls, but caution is needed for the weakening momentum at the hourly level and the risk of chain liquidations, suggesting to watch the gains and losses around $3,100 as a short-term bullish-bearish dividing line.

