Core views
Current price: $90,093 (as of December 9, 09:43)
24-hour decline of 1.28%, intraday high of $92,203, low of $89,736
Short-term outlook: Neutral to weak
The technical indicators show that the price is oscillating in a key support range, with bullish and bearish forces in a stalemate. Both the 1-hour and 4-hour levels are below the middle band of the Bollinger Bands, and the daily ADX strength reaches 32.74, reflecting a continuation of the downward trend. However, the MACD daily histogram turning positive indicates accumulation of bottom momentum. On-chain data shows a net outflow of 2,773 BTC, with exchange reserves decreasing, suggesting accumulation behavior. The funding rate in the derivatives market remains positive, with the maximum pain point for options at $91,000, and it is expected that the price will fluctuate in the range of $88,500-$91,500 within the next 24-48 hours.
Key support:
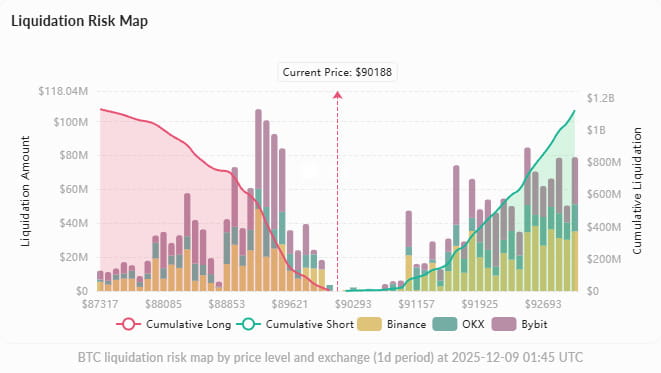
$89,000 - 1-hour Bollinger Band lower band intersecting with the 4-hour moving average, with accumulated long liquidation positions reaching $73 million.
$88,500 - Liquidation cluster area and daily Bollinger Band extension, with accumulated support reaching $66 million.
Key resistance:
$91,000 - 4-hour Bollinger Band upper band and recent swing high, short liquidation pressure of $47 million, maximum pain point for options expiring December 12
$92,000 - Psychological barrier and 4-hour 200 moving average position, short liquidation of $16 million
Technical analysis
Multi-cycle trend structure
Short cycle (1 hour): Prices at $90,059 are running below the Bollinger Band middle track ($90,963), below the 50-period EMA ($90,569) and 200-period EMA ($90,344), with ADX only at 15.66 showing no obvious trend, in a range-bound state. RSI at 43.26 is close to neutral but weak, MACD histogram at -103.76 maintains weakness, lacking directional breakthroughs in the short term.
Medium cycle (4 hours): Prices are close to the Bollinger Band middle track at $90,083, with ADX rising to 21.27 reflecting moderate trend strength, but below the 50-period EMA ($90,425) and far below the 200-period EMA ($93,966), confirming a medium-term bearish pattern. RSI at 47.37 is neutral, MACD histogram turns positive at +30.09, with the MACD line (-27.99) crossing above the signal line (-58.07), suggesting an early bullish divergence signal.
Long cycle (daily): Prices are in the upper half of the Bollinger Band (middle track $89,281, upper track $93,949), with ADX soaring to 32.74 indicating a strong downward trend, far below the 50-period EMA ($96,905) and 200-period EMA ($104,415). Although prices are above the middle track supporting a mildly bullish structure, RSI at 44.09 is weak, and the MACD histogram at +720.91 is expanding while the MACD line (-1,977.93) gradually approaches the signal line (-2,698.84), indicating that long-term bullish momentum is being built.
OBV (On-Balance Volume) declines across all cycles (1 hour -533, 4 hours -92,028, daily -281,822), indicating continued distribution rather than capital inflow, verifying insufficient buying confidence.
Key technical indicators
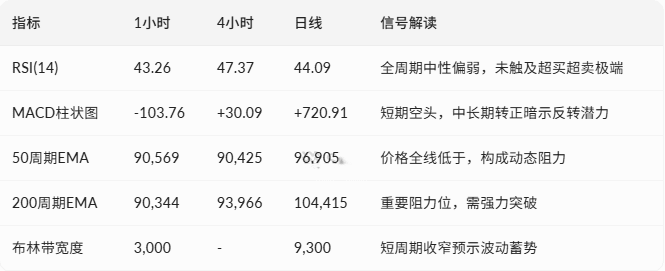
Bollinger Bands are narrowing at the 1-hour and 4-hour levels, indicating a precursor to a breakout in a low volatility environment; the daily band width of $9,300 maintains ample space, providing sufficient buffer for directional movements. Prices are consolidating near the multi-cycle middle track, and if they can stabilize above the middle track, it will activate upward momentum.
Support and resistance system
Immediate support range:
First support: $89,000 - 1-hour Bollinger Band lower band $88,722 and 4-hour EMA convergence point, a key technical support line, with accumulated long liquidation at $73 million forming passive buying support.
Second support: $88,500 - Liquidation cluster area ($66 million long position) overlapping with the daily Bollinger Band lower band extension, with a total liquidation amount reaching $1.1 billion (to $87,317) forming a strong support base.
Key resistance levels:
First resistance: $91,000 - 4-hour Bollinger Band upper band at $91,705 coinciding with recent swing high, short liquidation pressure of $47 million, also the maximum pain point for options expiring December 12, with prices tending to gravitate towards this.
Second resistance: $92,000 - Psychological round number and the 4-hour 200-period EMA (at $93,966), with short liquidation of $16 million, up to $93,077 cumulative liquidation reaching $1.1 billion, significant difficulty in breaking through.
The liquidation risk map shows concentrated long zones at $89,949 and $89,253, breaking below will trigger chain stop-loss; above $91,061 and $91,157 are densely packed short zones, breaking through could trigger a short squeeze.
Derivatives market
Futures positions and funding rates
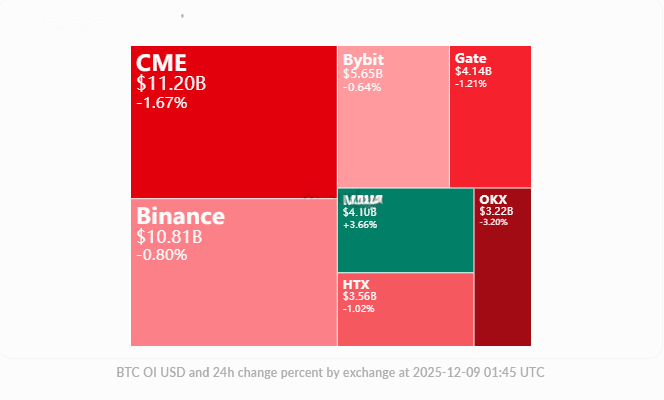
Total open interest $57.3 billion, down 0.79% in 24 hours, with Binance leading at $10.8 billion (down 0.8%), the contraction in leverage indicates market de-risking, favoring short-term consolidation.
Funding rates remain positive (Binance 0.0042%, Bybit 0.0049%), with long positions paying short positions every 8 hours, the next settlement around December 10 at 08:00, reflecting mildly bullish sentiment but excessive leverage among longs, with potential liquidation if prices pull back.
Options market structure
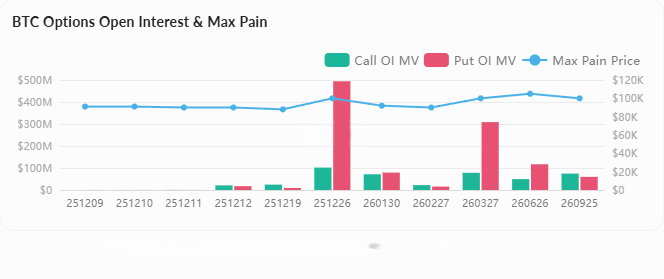
Total options open interest $52.3 billion (up 1.07% in 24 hours), with Deribit holding a dominant 82.9%. The maximum pain point is set at $91,000 (expires December 12) and $88,000 (expires December 19), with prices tending to converge towards the maximum pain point to maximize options sellers' profits, forming a price magnet center at $91,000 in the short term.
Total liquidation amount in 24 hours is $64.2 million (longs 51.7%, shorts 48.3%), with a balance between longs and shorts reflecting neutral wait-and-see sentiment, the risk map shows concentrated long exposure below $90,000 forming potential support.
On-chain and capital flow
Exchange net flow: On December 8, there was a net outflow of 2,773 BTC, with exchange reserves dropping to 2.76 million BTC (down 0.1% daily, down 1% weekly), continued outflows suggest that large holders or institutions are turning to cold wallet storage, reducing selling pressure expectations.
Institutional dynamics: Strategy (formerly MicroStrategy) increased holdings by 10,624 BTC on December 8, reaching a total of 660,624 BTC, becoming the third largest publicly traded company holder; Twenty One Capital completed a merger holding over 43,500 BTC (about $4 billion) and listed on the NYSE on December 9 with the ticker symbol XXI, supported by Tether, Bitfinex, and SoftBank, showing strong institutional allocation demand.
BlackRock deposited 1,197 BTC into Coinbase, and Coinbase internally transferred 1,929 BTC, reflecting the activity of ETF and custody services.
Macroeconomic and sentiment background
Policy catalysts: The Federal Reserve FOMC meeting is scheduled for December 9-10, with the market pricing a 86-87% probability of a 25 basis point rate cut to the 3.50-3.75% range, with expectations of liquidity easing supporting risk assets; Texas becomes the first U.S. state to hold Bitcoin, Senator Cynthia Lummis pushes to establish a strategic reserve bill for 1 million BTC with Trump's support, indicating improving regulation.
Market sentiment: Social media is generally bullish, emphasizing national and institutional adoption (global treasury holding over 4 million BTC), the CFTC announced that registered exchanges can trade spot Bitcoin and pilot BTC as tokenized collateral; however, the spot ETF has recently recorded net outflows, and retail investors remain cautious due to declines this year, forming a divergence from institutional optimism.
Reddit discussions show some expect a pullback to $60,000 before bouncing back, while others believe after consolidation it will test $94,000, reflecting a high degree of disagreement in key range speculation.
Short-term forecast and scenario simulation
Neutral range (60% probability): Prices maintain a fluctuation between $88,500 and $91,500, waiting for the FOMC decision and further institutional buying, testing resistance at $91,000 during the day but struggling to break through effectively, with a dip to support at $89,000 being supported.
Bullish scenario (25% probability): Breaking above $91,000 activates $47 million of short liquidation, combined with a 4-hour MACD golden cross confirmation and positive funding rate support, targeting $92,500 or even testing $93,000, requiring OBV to stop falling and ETF capital to turn inflow.
Bearish scenario (15% probability): Losing $89,000 triggers a chain reaction of stop-loss on $73 million long positions, combined with rising exchange reserves reversing or exacerbating liquidation pressure, with a dip to secondary support at $88,500, and in extreme cases testing the cumulative liquidation area at $87,300, requiring caution against the risk of derivatives leverage collapse.
Operational advice: Short-term traders should focus on the boundary of the range between $89,000 and $91,000, following the direction after a breakout; medium to long-term holders can utilize the pullback range of $88,500 to $89,000 for phased allocation, targeting above $95,000 with stop-loss set below $87,000.
