1. The market is on the verge of direction selection
The current Bitcoin market is at a critical turning point, especially whether there will be a rapid increase before Christmas, becoming the focus of market attention. Observing the recent trend, Bitcoin had a rebound to $92,000 at the 4-hour level, but then showed a significant long upper shadow, accompanied by certain volume, indicating that selling pressure above remains heavy. The daily chart also shows a long upper shadow, further confirming that bearish pressure is still ongoing.
$92,000 is undoubtedly the most critical short-term structural level. If it cannot stabilize, there is a risk of further decline; if it successfully stabilizes, it may open up space for a rebound to $100,000 or even higher.

Two, funding structure contradiction: CVD indicates weak spot momentum.
From CVD (Cumulative Volume Delta) and contract data, it can be observed that during the upward process, contract positions continuously increase, but the willingness to buy in the spot market is clearly insufficient, indicating that the recent rise is more likely driven by leveraged contracts rather than spot fund inflows.
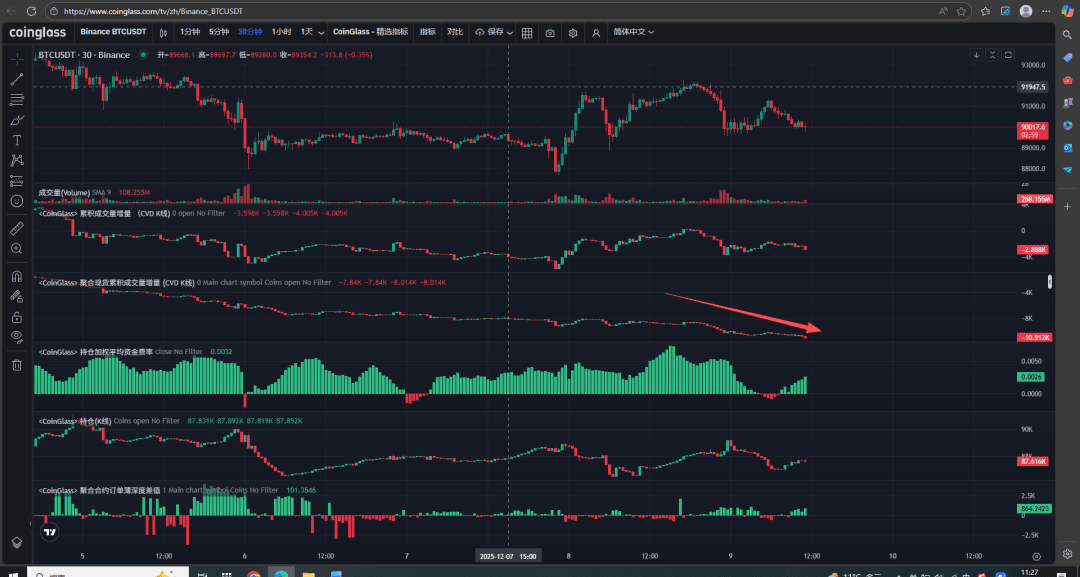
This structure implies:
The sustainability of the upward trend is weak; once contracts are settled or bullish strength diminishes, the price is likely to fall back.
Large funds in the market remain cautious about the spot, waiting for clearer macro signals.
If the subsequent spot CVD turns positive, it indicates that real buying has re-entered the market, which will make the rebound more sustainable and is an important indicator for judging future market trends.

Three, technical formation: converging triangle is about to give direction.
Currently, Bitcoin has formed a relatively standard converging triangle pattern:
The upper side is constrained by the downtrend since the previous high point;
The lower side presents a rebound structure with continuously rising lows.
Such converging structures usually indicate that the upcoming direction choice will be accompanied by a significant breakout, whether upwards or downwards, may form a significant market movement. Historical experience shows that this kind of pattern may oscillate for a long time, but once it breaks out, its trend continuity is extremely strong.
Four, macro variables: the divergence between hawkish and dovish rate cuts.
The most core influencing factor recently comes from the upcoming December meeting of the Federal Reserve. The market generally expects a rate cut, but the key is whether the nature of the rate cut is 'hawkish' or 'dovish'.
1. Risks of hawkish rate cuts.
According to Morgan Stanley's judgment:
The Federal Reserve is highly likely to cut rates to 3.5%–3.75% in December, entering the 'neutral interest rate range'.
Powell may raise the future rate cut threshold while cutting rates, indicating that there may be no more rate cuts in early 2026, entering a wait-and-see period.
This 'formally cutting rates but substantively hawkish' strategy will have two impacts:
Market liquidity recovery is limited, and bullish factors are not as expected;
Risk assets may face pressure, so large funds are currently leaning towards a wait-and-see approach, explaining why spot buy orders are not active.
However, large funds have repeatedly defended near $88,000, indicating that whales are still making defensive layouts in this range.
2. Possibility of a dovish rate cut.
Another viewpoint believes future policies will lean dovish:
In May 2026, the Federal Reserve Chairman may be replaced by Harker, who favors low interest rates;
If Cook is successfully replaced again, the future structure of the Federal Reserve will clearly lean towards low borrowing costs;
Among the 7 members of the Federal Reserve, 5 were appointed by Trump, overall leaning dovish.
Inflation falling back and the impact of tariffs being weaker than expected provide a basis for continued rate cuts.
If policy quickly approaches the 2% inflation target, risk assets (including Bitcoin) will welcome a significant boost.
Five, contradictions in market sentiment: contracts drive up, the spot is still hesitant.
Yesterday, although Bitcoin had a rebound, it fell after the US stock market opened, indicating that the buying power of real funds is not strong.
The market shows:
Rebounds are mostly driven by contracts;
Contract direction is slightly bearish;
Spot continues to show signs of reduction at high levels.
This structure reinforces the current market's atmosphere of 'uncertainty', also turning the $92,000 and $89,000 range into the main battleground for bulls and bears in the short term.
Six, technical basis for upward movement before Christmas.
Although there are contradictions in macro and funding levels, the technical aspect still gives a certain probability of upward movement, especially before Christmas, which may welcome a wave of strengthening:
Key signals:
1.4-hour level bottom divergence is obvious.
MACD has shown multiple bottom divergences, indicating a weakening of bearish strength.
2. The lower side repeatedly supports buying.
Each time it breaks below the short-term structure, it is quickly pulled back by buying, indicating that the lower support truly exists.
3. If it breaks through the $94,000–$92,000 range and stabilizes
It will form a breakout confirmation and trigger the 123 rule, looking towards $98,000–$100,000.
4. Fibonacci 0.618 retracement level is at $108,000.
This position coincides with the area of dense transactions (POC); once breaking through $98,000–$100,000, the market may directly point to $108,000.
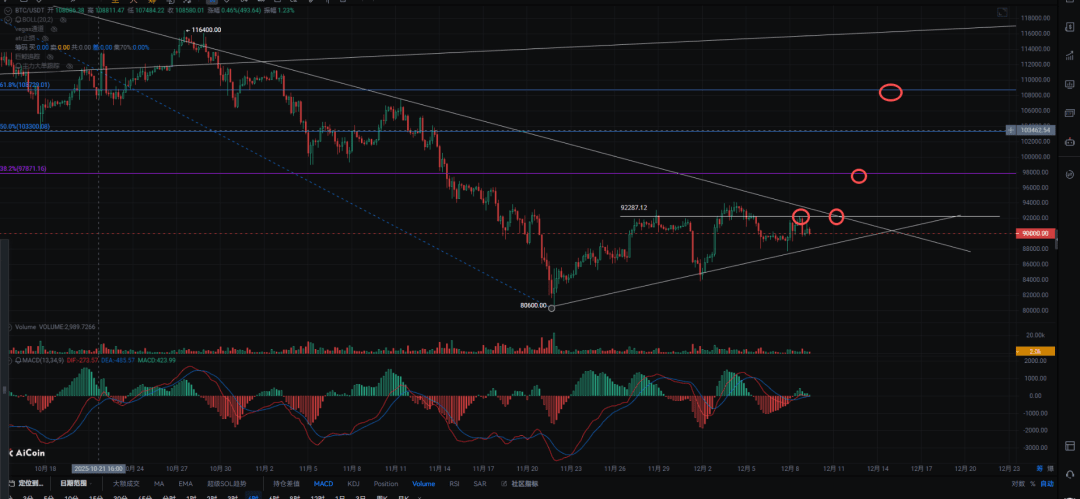
Therefore, if a dovish policy or increased spot inflow appears before Christmas, Bitcoin indeed has the potential to hit $100,000 or even $108,000.
Seven, trading strategy: patiently wait for better entry points.
Based on the current structure, relatively robust strategies include:
1. Pullback to go long (conservative approach).
If the price falls back to around $88,000
Does not break below the previous low, or quickly recovers after breaking it.
Small levels show a bullish engulfing structure.
→ Can try to go long in line with the trend, with stop-loss placed below the lower shadow.
2. Wait for the breakout to chase long (trend-following approach).
If the price successfully stabilizes in the $92,000–$94,000 range
→ Can follow the trend upwards, target $98,000–$108,000.
3. Shorting risks are high, it is not recommended to heavily test the waters.
$94,000 is no longer a strong pressure zone; short stop-losses are easily breached, and the current cost-effectiveness of shorting is low.
Eight, summary: the key to the market is 'patience'.
Whether it is Bitcoin, Ethereum, or altcoins, the short-term direction ultimately depends on when Bitcoin, as the core asset, breaks out of the triangular range.
The current contradiction in the market is:
Technical sentiment is bullish.
The funding and macro aspects balance each other.
Both bulls and bears form a key tug-of-war at $89,000–$92,000.
In this structure, patiently waiting for the optimal price and breakout signals far outweighs emotional trading.

