---$ZEC
🔥 ZEC/USDT – A Massive Rebound May Be Starting! FULL ANALYSIS & FUTURE OUTLOOK 🔥
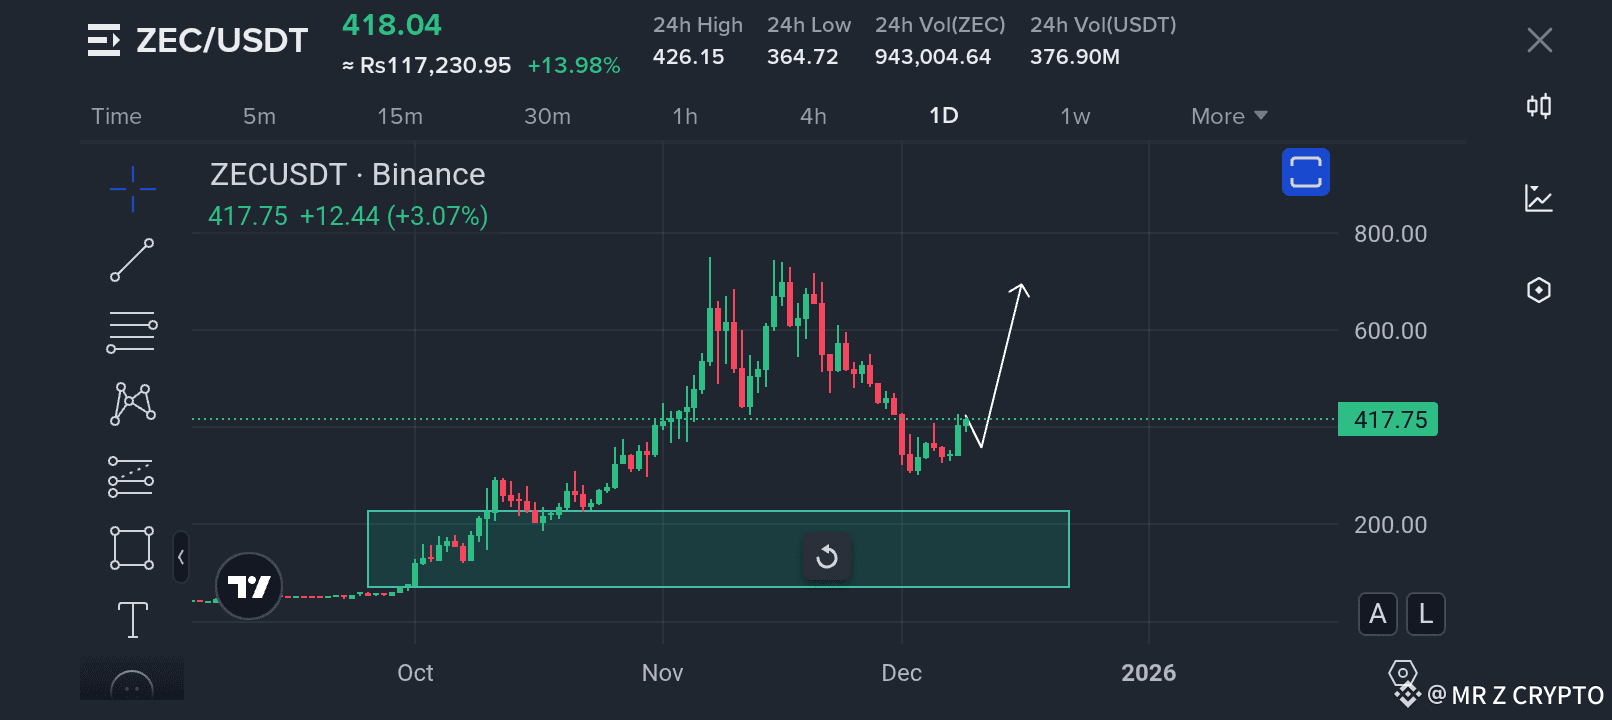
📈 Daily Timeframe · Binance Chart Review
The market has been quiet for a while, but the chart of Zcash (ZEC) is finally showing something big — something traders look for after long periods of correction. The recent price action is signaling a potential trend reversal, and the structure is becoming extremely interesting for those who know how to read market cycles.
Let’s break everything down step by step so you understand exactly what’s happening and what may come next.
🚀 1. The Bigger Picture – Strong Rally Followed by Healthy Correction
During October and November, ZEC made one of its strongest moves of the year, rallying aggressively from the lower support areas all the way toward the higher 600+ regions. This was a powerful impulsive wave driven by high volume, strong demand, and renewed market confidence.
However, no asset moves in a straight line forever. After a huge rally, markets will naturally cool off — and that’s exactly what we saw:
A slow decline
Lower highs forming
Shrinking candles
Gradual drop toward the previously highlighted demand zone
This wasn’t weakness.
This was normal profit-taking.
This was the market resetting.
And now, things are becoming interesting again.
💎 2. The Demand Zone Did Its Job Perfectly
The green zone highlighted on the chart represents a major demand area — a region where large buyers previously stepped in. When price revisits such areas, smart traders expect one of two outcomes:
1️⃣ Either it breaks and falls much lower
2️⃣ Or it reverses strongly because buyers react again
In this case, the second scenario is unfolding beautifully:
✔ The price bounced strongly from the zone
✔ Multiple candles show long bottoms (buying pressure)
✔ Sellers are losing dominance
✔ Momentum is shifting back toward the bulls
This is exactly the kind of behavior that marks the beginning of a recovery phase.
📊 3. Trend Reversal Signals: What’s Happening Right Now
Let’s understand the current structure:
🔹 ZEC is forming a higher low — a major reversal signal
🔹 Buyers are defending the 380–400 zone strongly
🔹 Daily candle bodies are getting larger again
🔹 Momentum indicators (structure-wise) are turning bullish
🔹 A clean breakout attempt is forming around 417+
This is the first time since the November correction that ZEC is showing such confidence.
This tells us:
The downtrend might be ending, and a new climb may be starting.
📈 4. Expected Short-Term Move (Next Days to Weeks)
If the current momentum continues, here is the likely path ZEC might follow:
1️⃣ Small retest of the 410–420 zone
2️⃣ Break above the 430–450 resistance area
3️⃣ Gradual move toward the higher 500+ region
4️⃣ Attempt to test the previous swing highs
This scenario is supported by both:
Market structure
Demand zone bounce
Buying pressure returning
The arrow shown in the chart represents this potential bullish path.
🎯 5. Key Levels Every Trader Should Watch
🔵 Support Zones
🟩 Major Support: 250 – 320 USDT
🟩 Immediate Support: 380 – 400 USDT
Buyers have shown strong interest here, and losing this zone would change the outlook.
🔴 Resistance Zones
🔺 Immediate Resistance: 430 – 450 USDT
🔺 Major Resistance: 520 – 600 USDT
Breaking the 450 level would open the door for a powerful upward rally.
🌟 6. Why This Bounce Is So Important
ZEC has a limited supply and historical behavior that shows:
📌 When it pumps, it pumps FAST
📌 When it reverses, the strength is explosive
📌 When accumulation happens, big moves follow
This bounce is coming exactly where long-term investors were expected to return.
This is not random.
This is not noise.
This is market structure aligning with demand.
And when that happens, big moves often follow.
⚠️ 7. Smart Trading Mindset (Don’t Skip This!)
If you are trading or observing this move, keep this in mind:
✔ Avoid chasing sudden green candles
✔ Plan entries around support and confirmations
✔ Don’t rush — patience always wins
✔ Use proper risk management
✔ Follow the trend, not emotions
Most losses come from emotional decisions, not from analysis.
🗣 8. What Do YOU Think?
Do you believe ZEC is starting a new bullish wave?
Will it break 450 soon?
Or do you expect another dip before a major rally?
Share your thoughts below!
Let’s get the discussion going! 🔥⬇️
---