---$LRC
📊 LRC/USDT – Detailed Market Outlook & Analysis
The calm is finally breaking… and Loopring might be entering a new phase.
For several months now, LRC has been trading inside a narrow range, slowly drifting downward and forming a prolonged accumulation zone. Many traders had already lost interest, and volume was drying up — a classic sign of market exhaustion. But today, the chart delivered a strong and surprising move that has grabbed the attention of the entire community.
This sudden spike isn’t just another random candle. Instead, it may be the first signal of a potential trend reversal, especially after weeks of bearish pressure.
---
🔥 1. Market Structure Overview
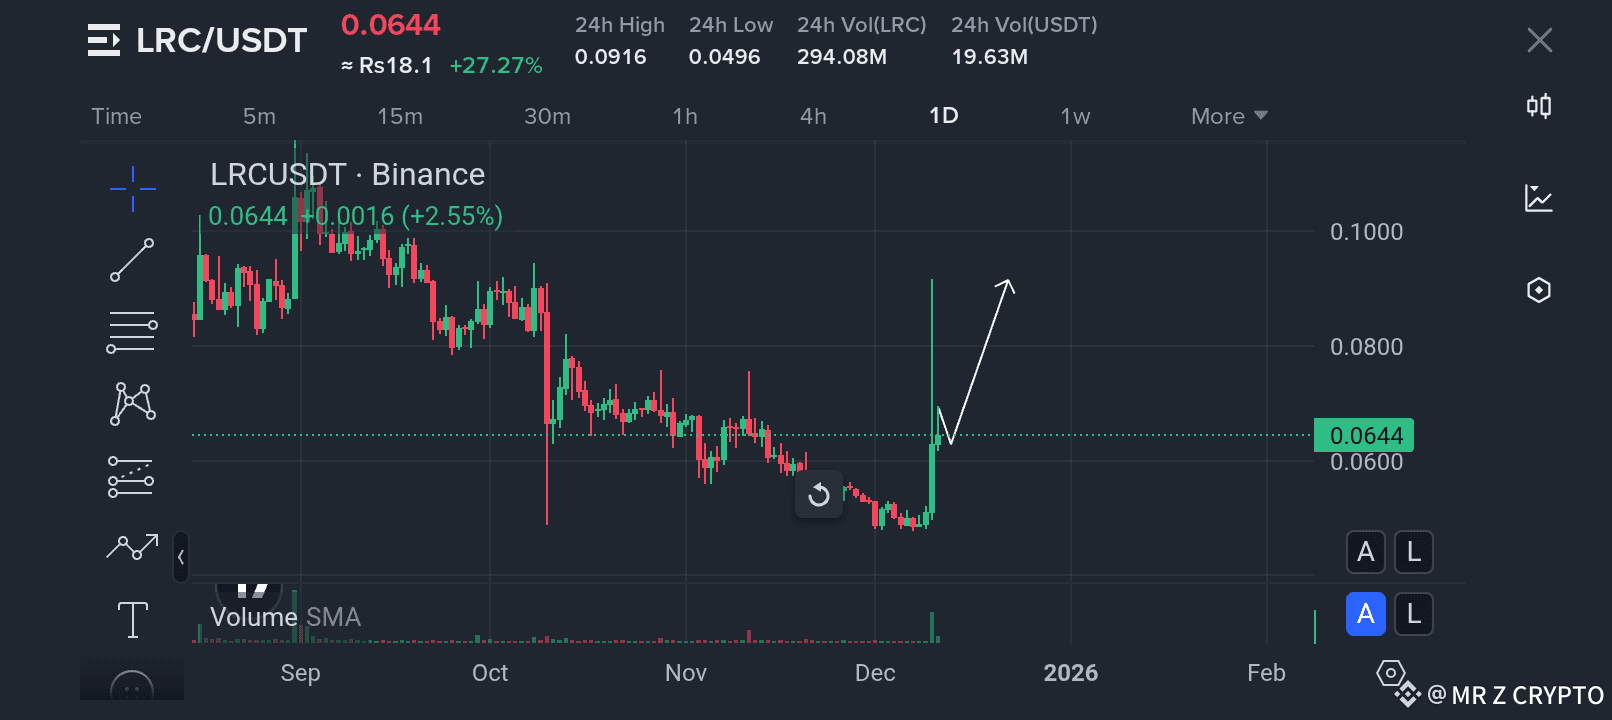
Looking at the broader structure, LRC was stuck between $0.060 – $0.065 for a long period. Price kept respecting the lower support but showed no sign of true strength… until now.
The latest daily candle completely changed the sentiment. A powerful green candle broke above recent resistance levels, closing near the top of the day’s range. This kind of candle typically indicates aggressive buying and fresh liquidity entering the market.
What’s even more important is the presence of increased trading volume. When price rises with strong volume, it confirms that the move is not just a small whale manipulation — but real market participation.
---
📈 2. Why This Move Matters
This breakout came after:
A strong downtrend in the previous weeks
Heavy accumulation around the lower prices
A period of extremely low volatility
A massive bullish candle that stands out from all recent price action
Historically, such patterns often mark the end of a bearish cycle and the beginning of a new bullish phase.
This doesn't mean LRC will shoot up nonstop, but it does show that the market is waking up and the buyers are gaining control.
---
🔍 3. Expected Short-Term Movement
The white arrow projection in the chart shows the most probable scenario:
1. A slight pullback or consolidation around the breakout level.
2. Buyers stepping in to push price upward again.
3. A move toward the next resistance levels.
Key short-term levels to watch:
$0.067 – $0.070 → immediate resistance
$0.073 – $0.075 → short-term target if momentum continues
If the structure holds and volume stays strong, we could see continuation toward $0.080+ in the coming sessions.
---
🧠 4. Bullish Indicators Building Up
Here’s what makes the current setup interesting:
Volume spike confirming the breakout
First strong bullish candle after long red pressure
Support respected multiple times
Momentum shifting in the bulls’ favor
Market sentiment improving across the board
These are the types of signals smart traders look for before momentum builds.
---
📌 5. What Traders Should Keep in Mind
This is not a time for panic buying or FOMO. Instead, it’s a moment to observe carefully:
Pullbacks are normal and healthy — don’t be scared of them.
The best opportunities often come after retests, not during the spike.
Putting emotions aside is the key to successful trading.
If price retests the breakout zone around $0.062–$0.064 and holds, it could give a cleaner continuation move.
---
🚀 6. Mid-Term Outlook
If the bullish momentum continues, LRC may try to climb toward:
$0.090 – $0.100 → strong mid-term targets
Psychological round number $0.10
Above that, the market might enter a more aggressive bullish structure
While nothing is guaranteed, the current chart suggests that a bigger move could be developing, especially if Bitcoin remains stable.
---
⭐ Final Words
Loopring has finally woken up after months of silence. The strong breakout candle, increased trading volume, and change in market structure all point toward a possible shift in trend. Whether you're a trader or a long-term holder, the coming days could bring significant opportunities.
Stay focused. Watch the key levels. And remember — patience is a trader’s greatest weapon.
More updates soon… 📡📈🔥
---