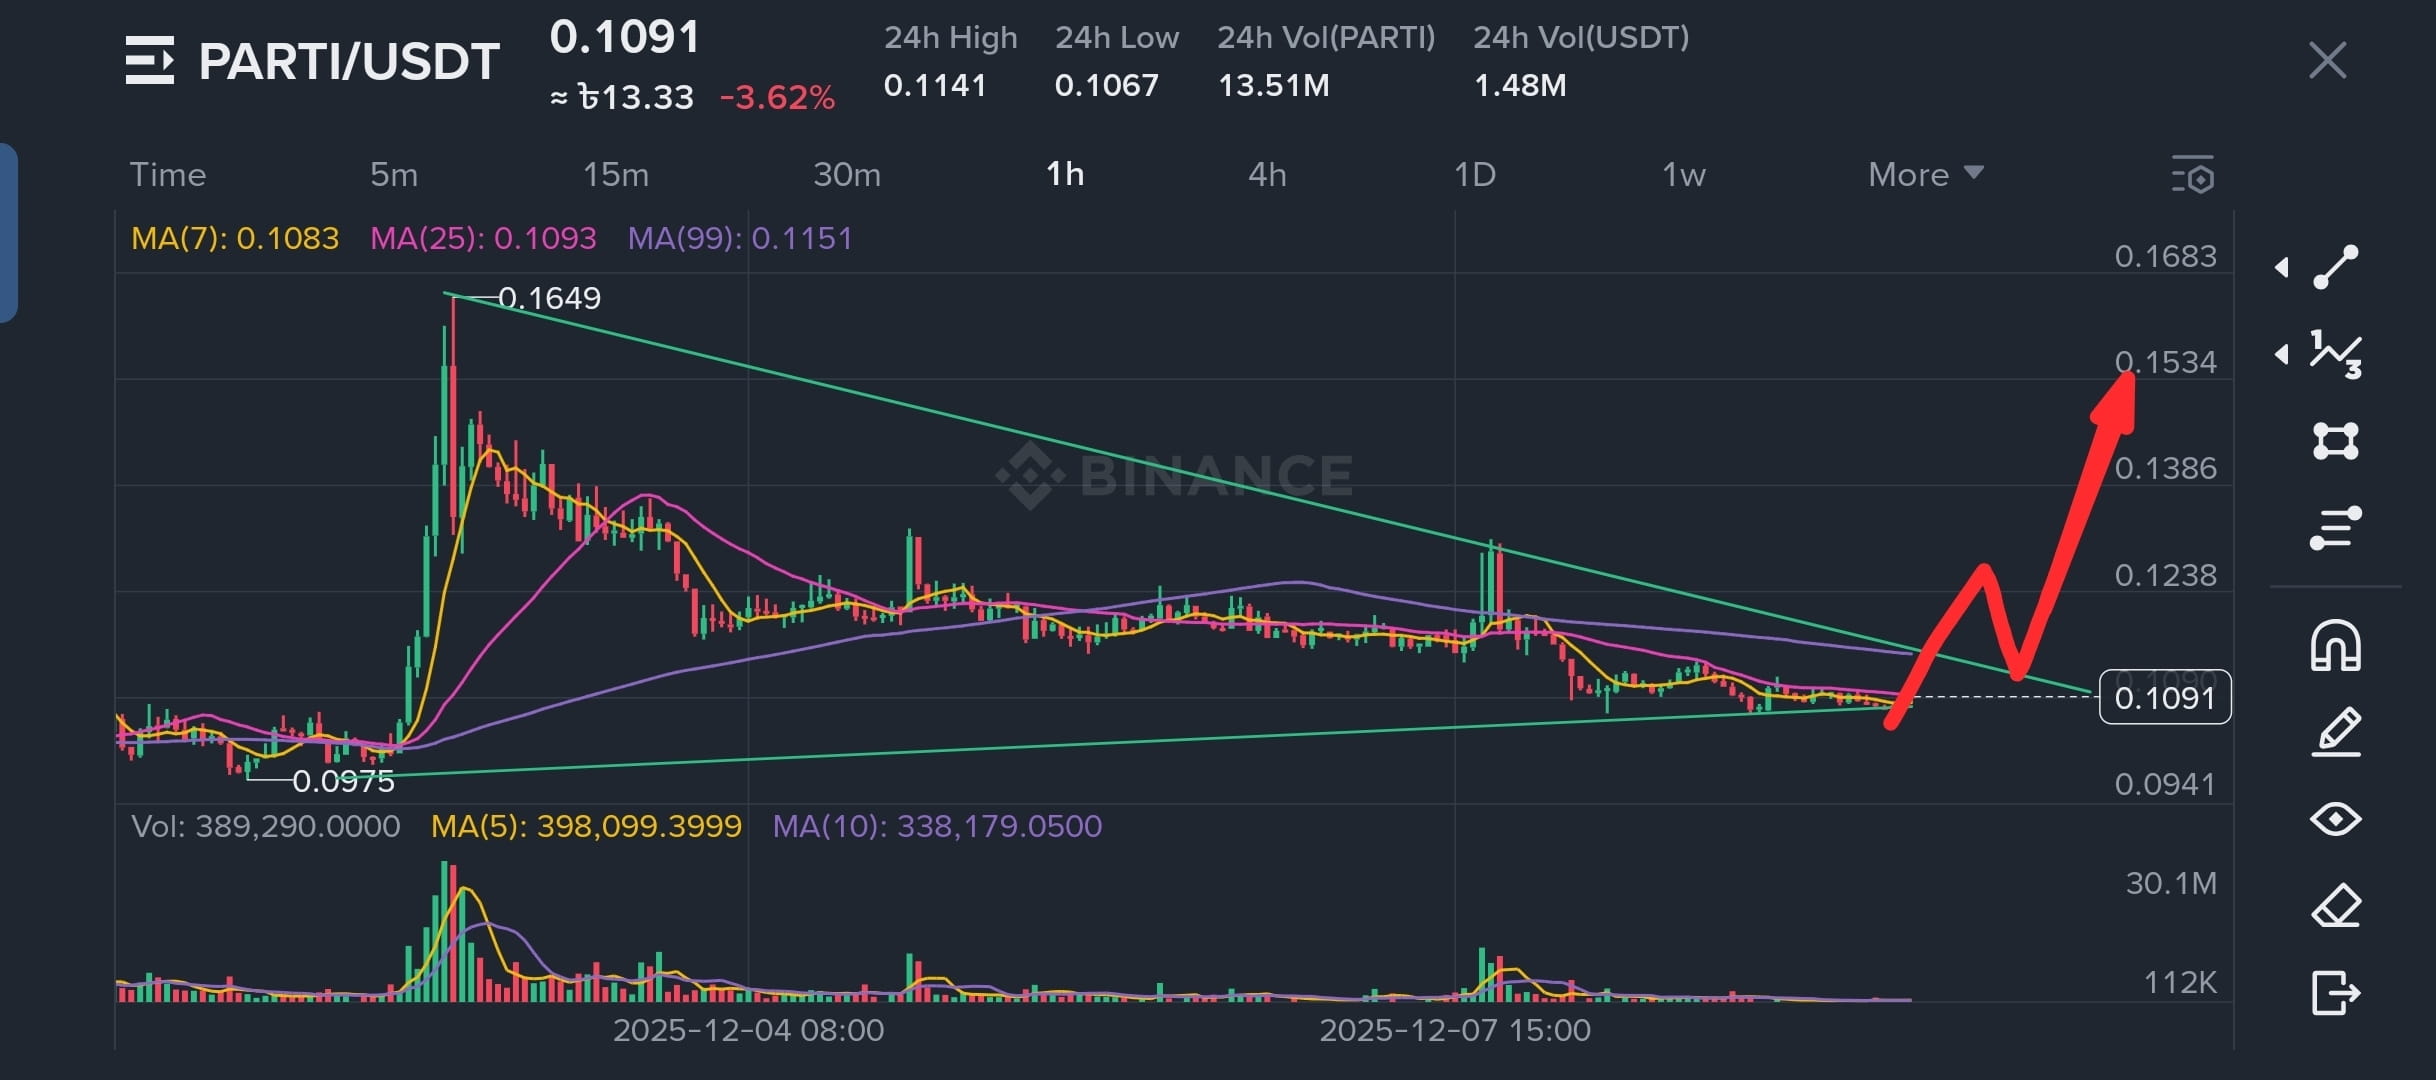
PARTI/USDT Long Analysis – Waiting for Possible Breakout
Current Price: $0.1091
Timeframe: 1h
Structure: Falling Wedge + Strong Support Zone
---
⭐ Market Structure Overview
According to the recent chart, the PARTI token is trading within a Falling Wedge Pattern. This pattern usually indicates a bullish reversal.
The price has repeatedly found support at the lower trendline, and now it's consolidating near support + MA(7) + MA(25).
This means – the token is preparing for a big move.
---
⭐ Bullish Signals (Possible Long)
🔸 1. Falling Wedge Breakout Probability
The upper downtrend line on the chart is gradually weakening.
Once 0.112–0.115 breaks, there will be a potential move towards 0.123 → 0.138 → 0.153.
🔸 2. Volume Compression → Expansion
Compression is observed at the lower volume levels.
Such volume compression usually occurs before a big move.
🔸 3. Strong Support at $0.0975 – $0.105
Buyers have entered the market several times from this zone.
The more times support holds – the higher the chances of a bullish reversal.
---
⭐ Possible Long Targets
Target Zone Price Level
TP1 0.123
TP2 0.138
TP3 0.153
According to the red arrow you drew on the chart, there is a possibility of reaching TP3.
---
⭐ Stop-Loss (SL) Suggestion
👉 If the 1h candle closes below 0.0975, keeping SL is safe.
Because if this level breaks, the trend will weaken.
---
⭐ Why Long Position Makes Sense Now
Price is at the last part of the wedge.
Support is very strong.
The MA lines are flat – indicating the potential for a big move.
A quick rally may happen if there is a breakout.
If the breakout is confirmed correctly, PARTI/USDT can provide a nice long entry setup.
---
🔥 Conclusion
The PARTI token is currently within a bullish reversal pattern. According to the current structure of the chart, a strong upward move may be seen very soon. For those looking to trade long, this is a good potential setup – but entry must be taken only after confirming the breakout.