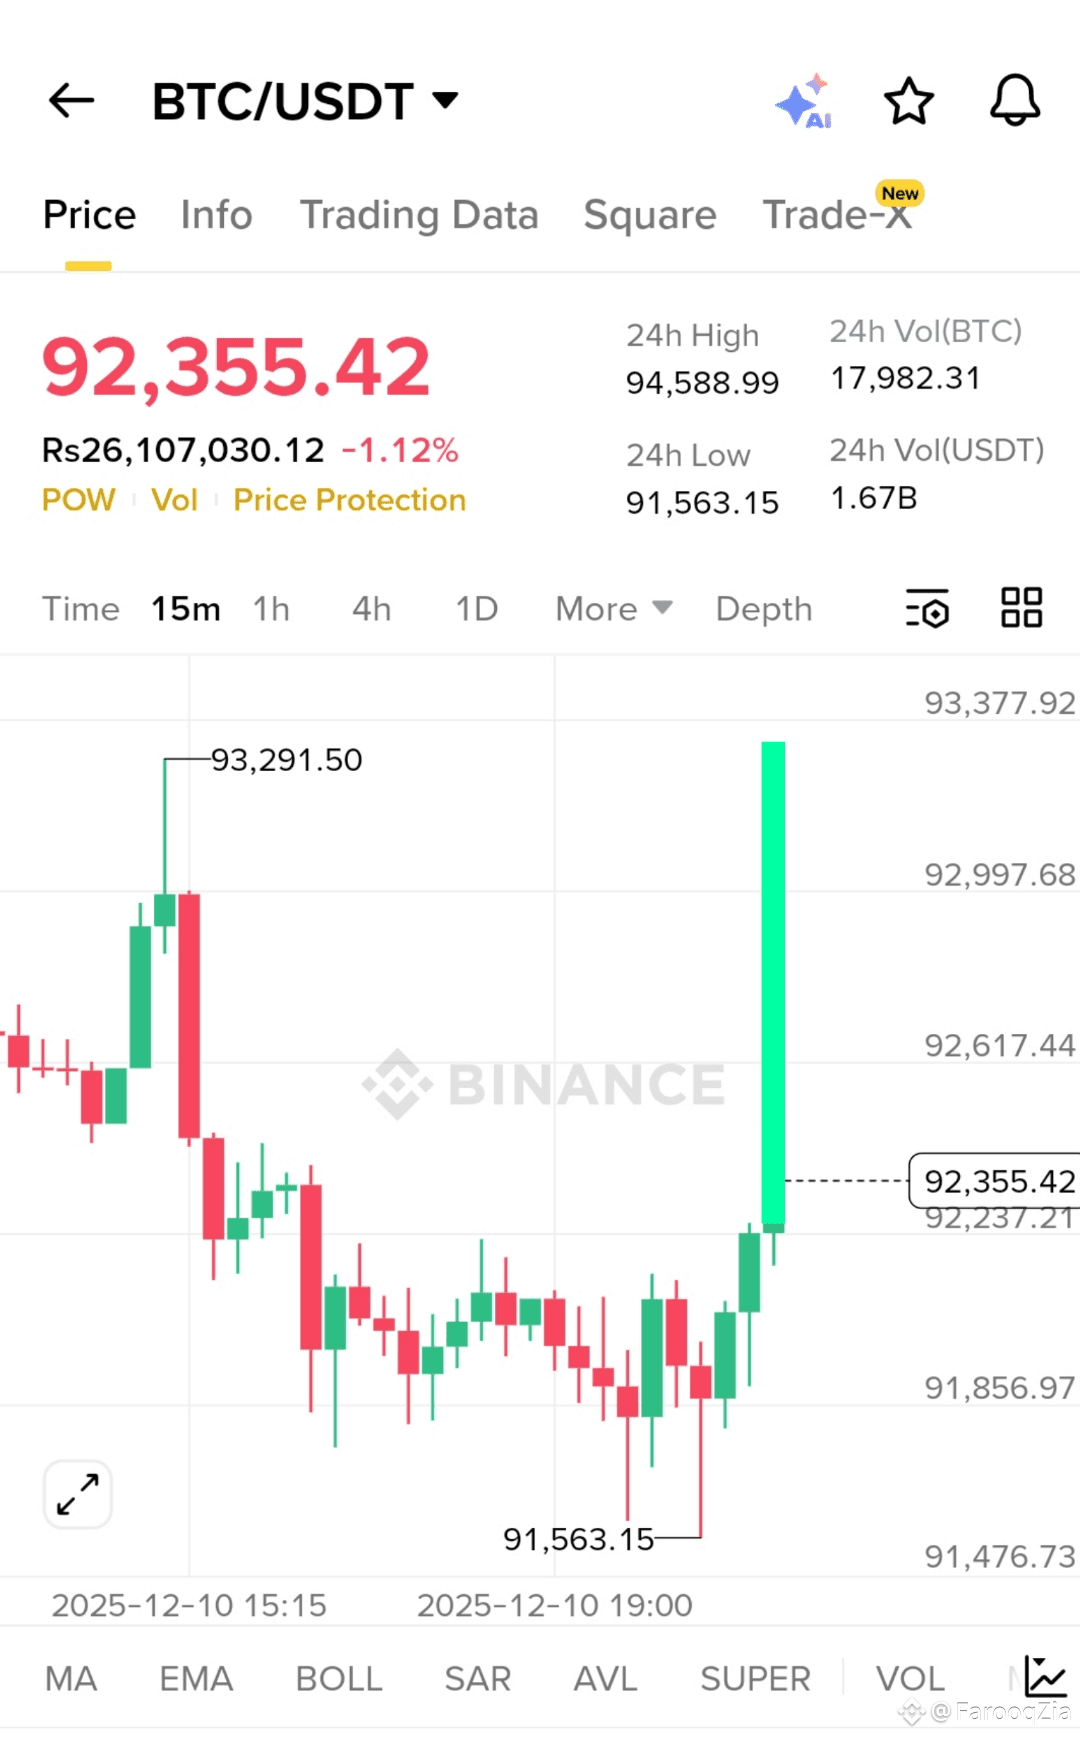
The image you provided shows a significant green candlestick on the 15-minute (15m) chart, following a period of decline and consolidation.
* Prior Price Action (Downtrend/Consolidation): The chart shows the price dropped from around $93,291.50 down to a low of $91,563.15, followed by a period of small, mixed (red and green) candles, indicating indecision or consolidation near a potential support level ($91,563.15 is the 24h Low).
* The Bullish Candle (The Signal): The most recent, very tall green candle (the one with the wick extending up to $93,377.92) is a strong indication of a sudden and intense buying pressure.
* This rapid move from the consolidation area could be interpreted as a bullish breakout or a potential trend reversal from the preceding small downtrend.
* Current Price: The price is shown at $92,355.42. This is a significant recovery from the low.
🎯 Long Trade Interpretation
The large green candle acts as a strong, immediate visual confirmation of buying strength.
* Entry: A trader might consider entering a long position (buying) as a breakout confirmation, either as this large green candle closes or on a retest of the top of the preceding red candles.
* Stop-Loss: A stop-loss order would typically be placed below the most recent swing low, which in this case is the 24h Low of $91,563.15, to protect against the signal failing and the price dropping further.
* Target: Initial profit targets would be the high of the current green candle's wick, or the previous high ($93,291.50).
In simple terms, the huge green candle suggests the buyers have taken control, and the market could be heading up.
Important Note: This is a basic technical observation based only on the visual chart pattern. Successful trading requires combining this with other factors like volume, market indicators (MA, EMA, BOLL, SAR, etc., which are listed at the bottom), fundamental analysis, and proper risk management. The candle is on a small 15-minute timeframe, meaning this strong move may only be short-lived.
follow for updates