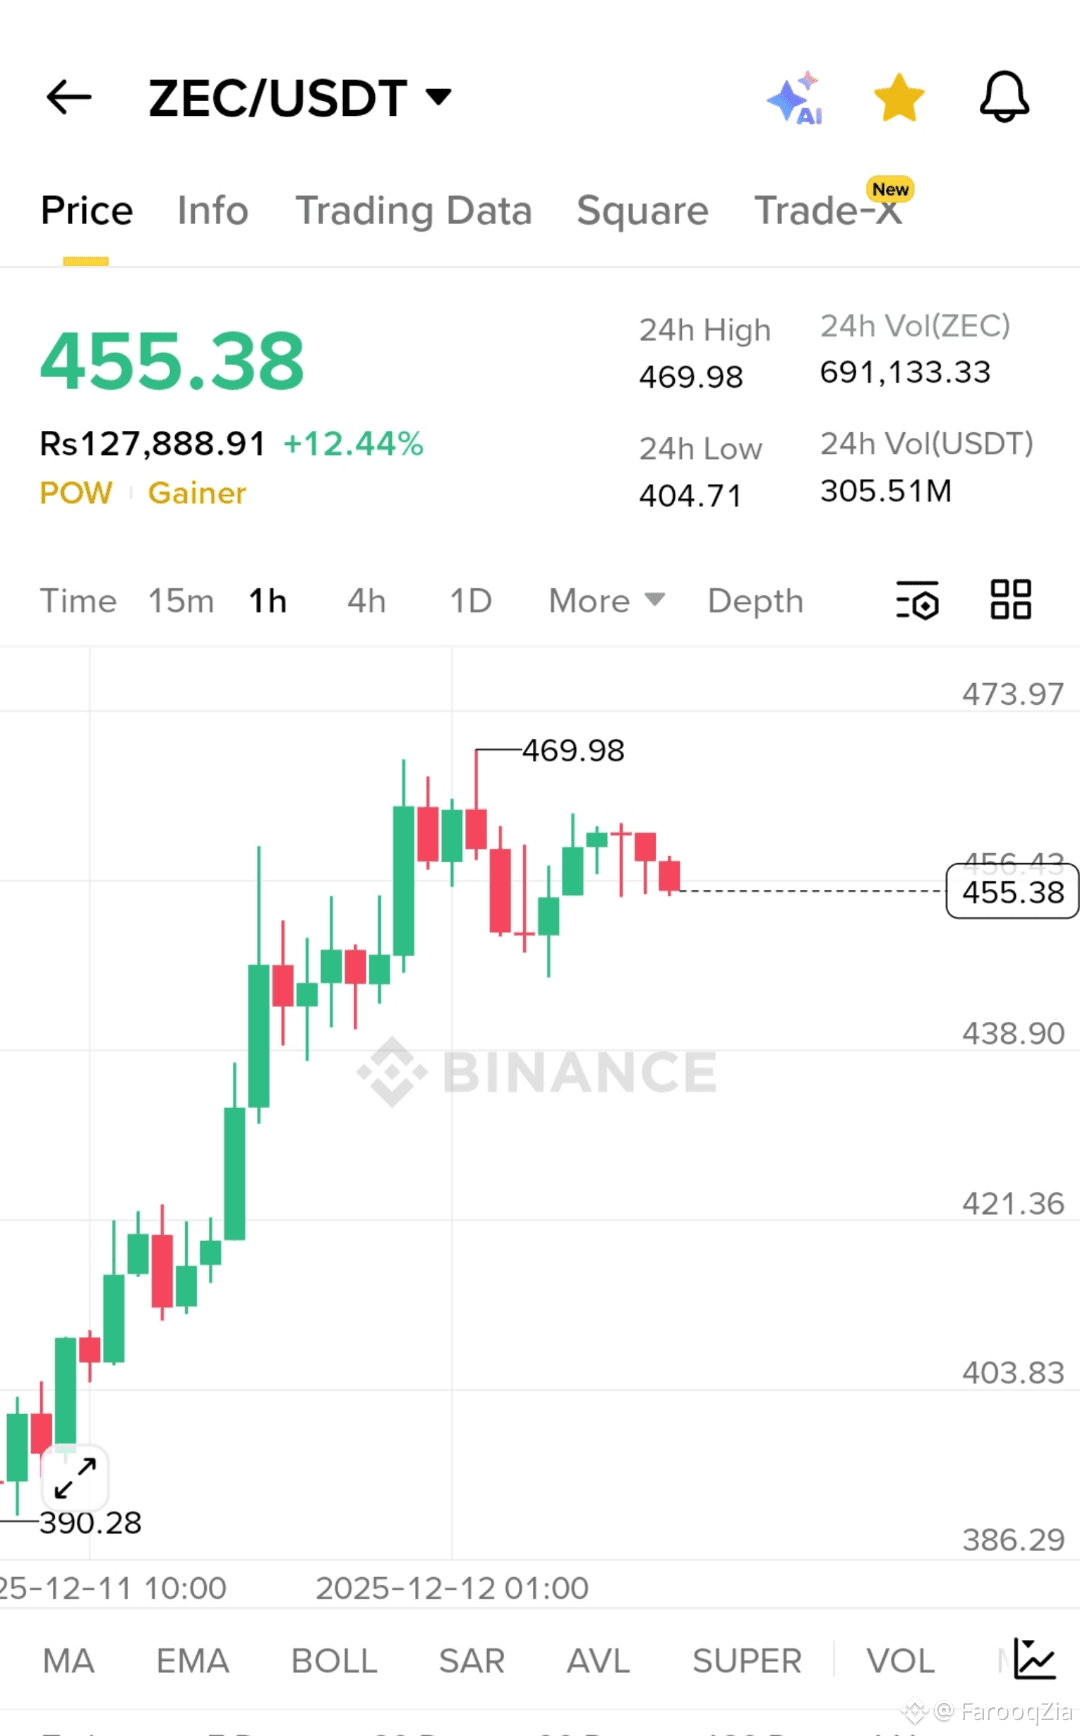
The chart shows a strong, significant uptrend over the period displayed (from roughly 10:00 on Dec 11 to 01:00 on Dec 12, 2025).
* Bullish Action: The price has moved from a low of around $390.28 to the current price of $455.38, representing a large increase of +12.44% in the 24-hour period.
* Recent Consolidation: In the very last few candles (right side of the chart), the price appears to be moving sideways, or consolidating, just under the 24-hour high of $469.98. This can be a sign of the upward momentum temporarily slowing down after a big move.
* Potential for Shorting:
The last few red candles and the current sideways movement suggest that the price is meeting resistance near the high. This area of consolidation below a recent high is where some traders might look to short (bet on the price going down) in anticipation of a pullback or a retracement after the sharp rally.
Conclusion:
While the overall trend on the chart is Bullish (Up), the recent price action indicates a potential for a short-term pullback or "short" opportunity from the consolidation area, especially if the price fails to break convincingly above the $469.98 high.
Disclaimer:
This is a basic technical observation of the chart. Trading is risky, and I am not a financial advisor. Any trading decision should be based on your own in-depth analysis and risk tolerance.


#BinanceBlockchainWeek #BTCVSGOLD #TrumpTariffs #WriteToEarnUpgrade #BinanceAlphaAlert
