The risk of Cardano's (ADA) price dropping by 39% continues, supported by the bear flag pattern and hidden bearish divergence. Whale movements and increased spent coins show that traders are selling on the bounces. ADA must reclaim the $0.55 level to avoid collapsing towards $0.37 and $0.25.
Article Details:
Cardano's price has risen by 8.6% over the past 24 hours, amid growing excitement about its new "Midnight" network, a privacy-focused sidechain. In the lunar cycle, the "midnight" phase usually indicates a reset — a moment preceding a new beginning. But for ADA, this reset may instead indicate the start of a new decline.
The price is still trading within a bearish pattern, momentum remains weak, and several on-chain signals indicate the possibility of the same bearish trend continuing that has dominated for months. Could this be the start of a 39% drop in ADA's price?
1. The bear flag pattern and bearish divergence still favor the downward trend.
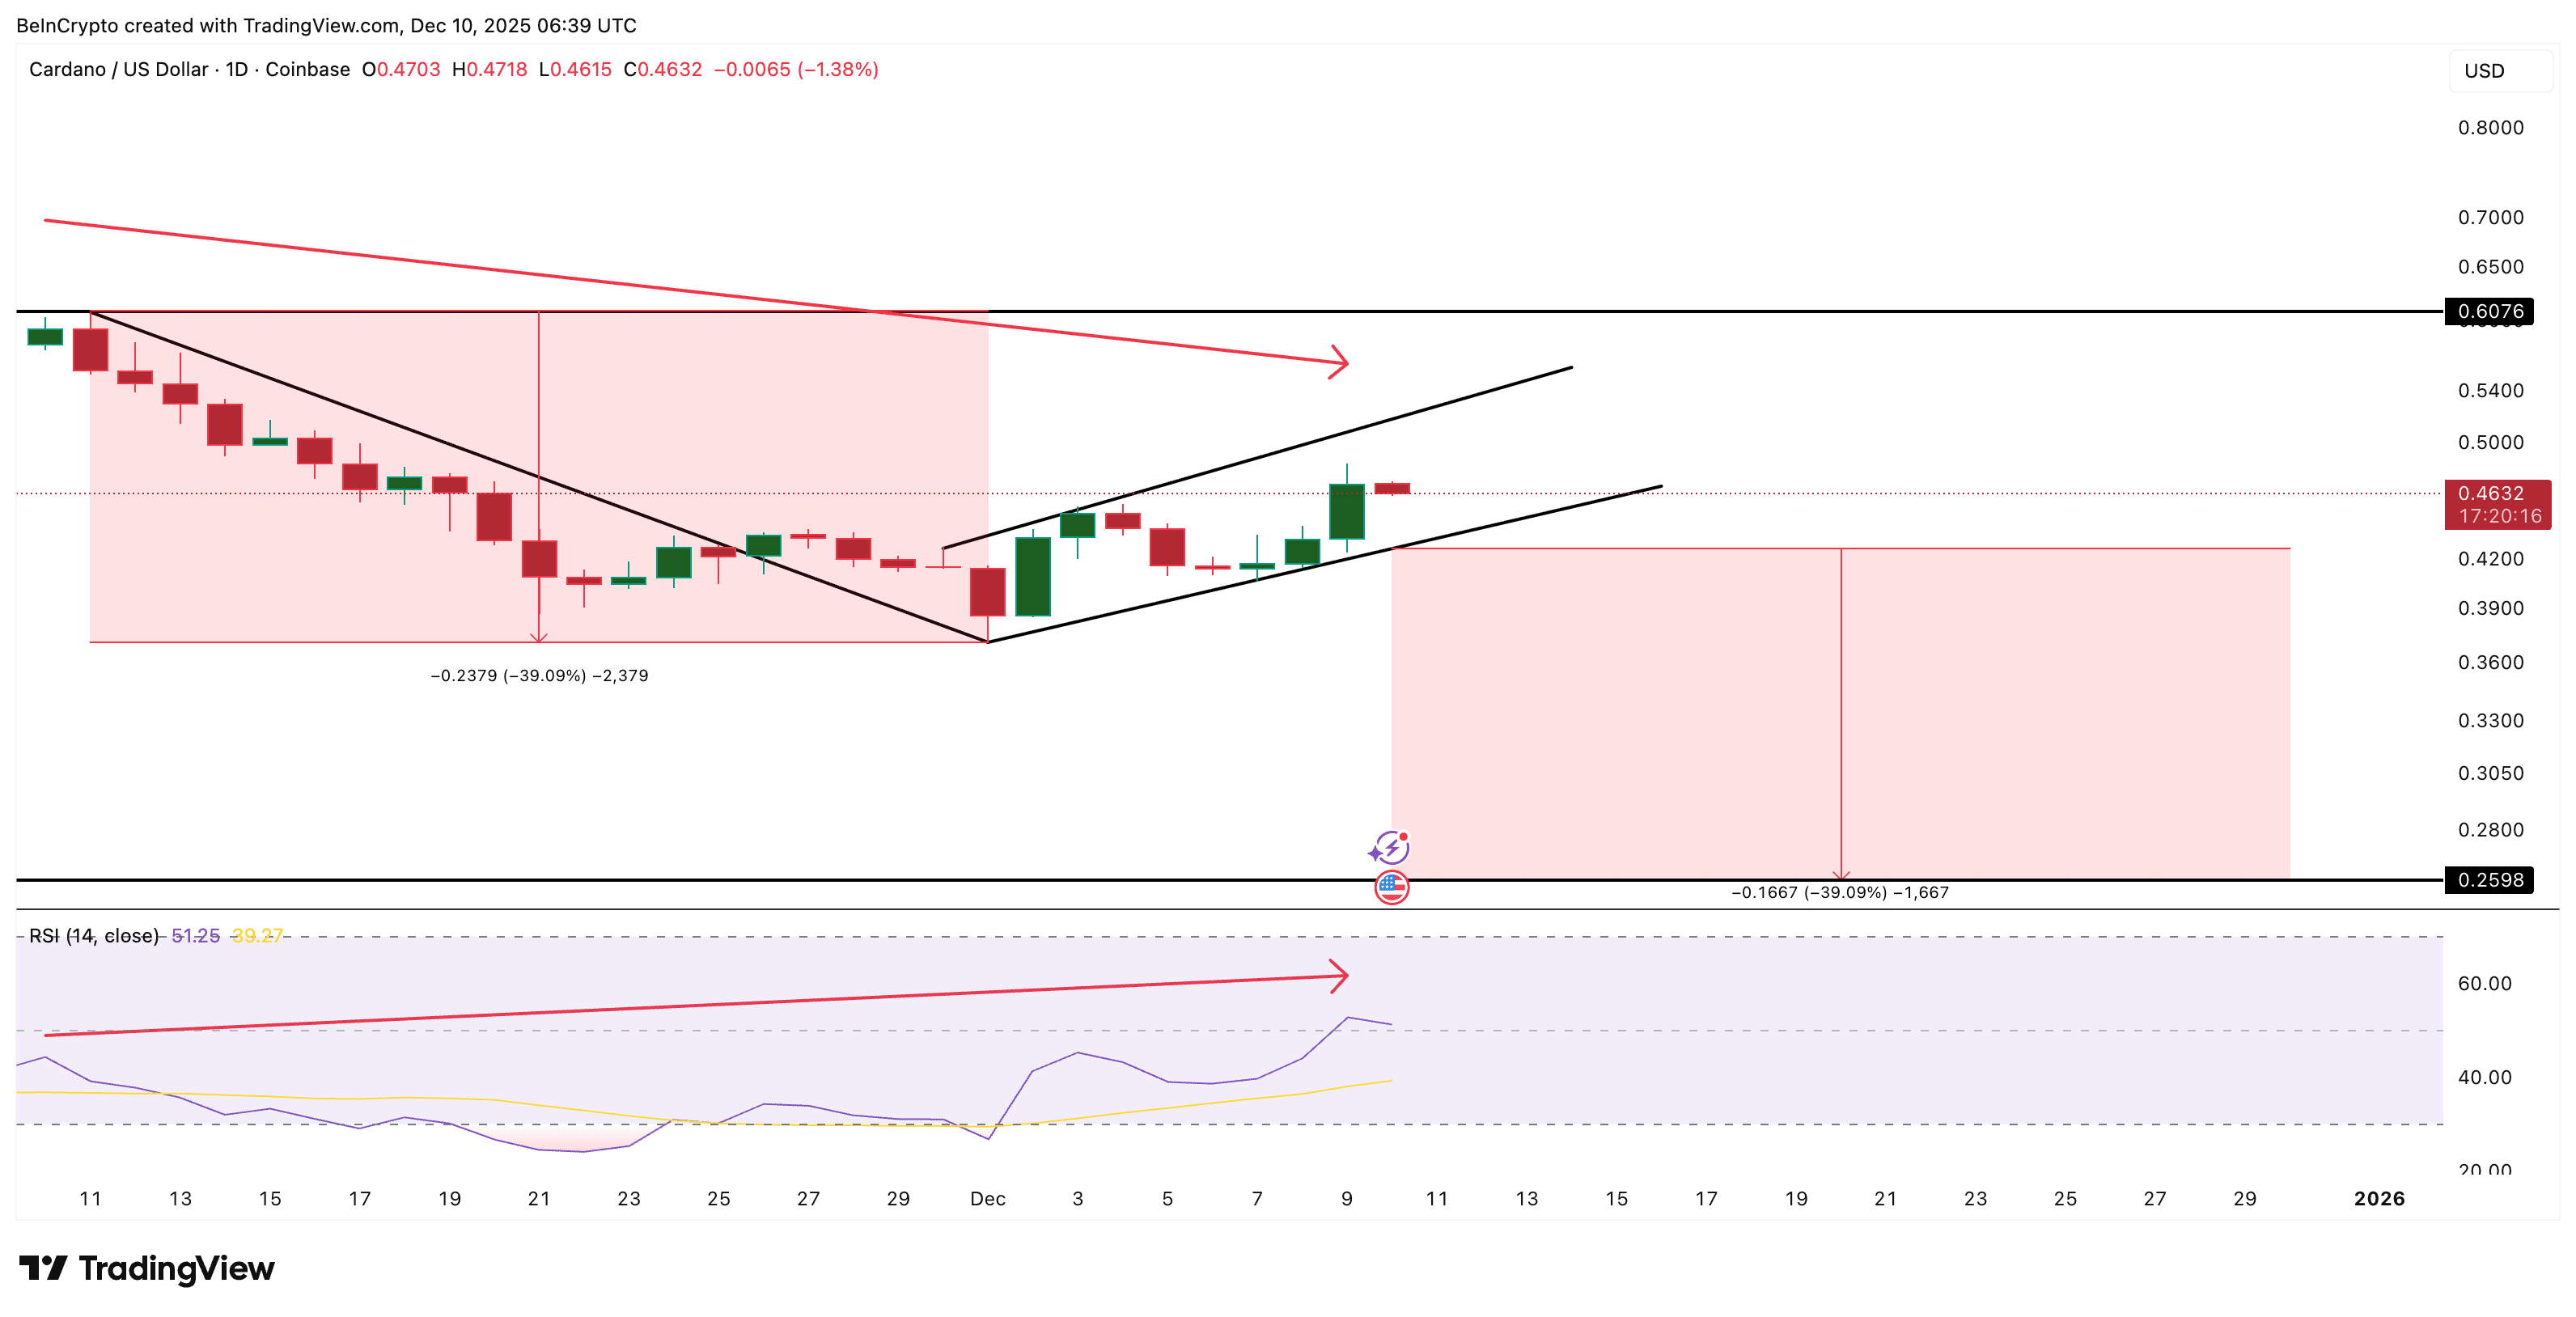
Cardano is still trading within the bear flag pattern on the daily chart. This pattern forms when a sharp drop is followed by a smaller upward-sloping channel, and this channel often acts as a pause before the same bearish trend continues.
Between November 10 and December 9, ADA's price recorded a lower high, while the Relative Strength Index (RSI) recorded a higher high. This is considered a "Hidden Bearish Divergence," and when the RSI rises but the price fails to keep up, it often indicates that the bounce is weak and sellers are still in control of the trend. This divergence supports the idea that the bearish trend is not over yet.
The pole of the bear flag pattern suggests a potential 39% decline if the lower trend line is broken. This movement could place ADA's price near the $0.25 level, which is a deeper bearish target.
2. Whales are exiting and spent coins are rising — are traders selling into the bounce?
On-chain signals align with the downward chart:
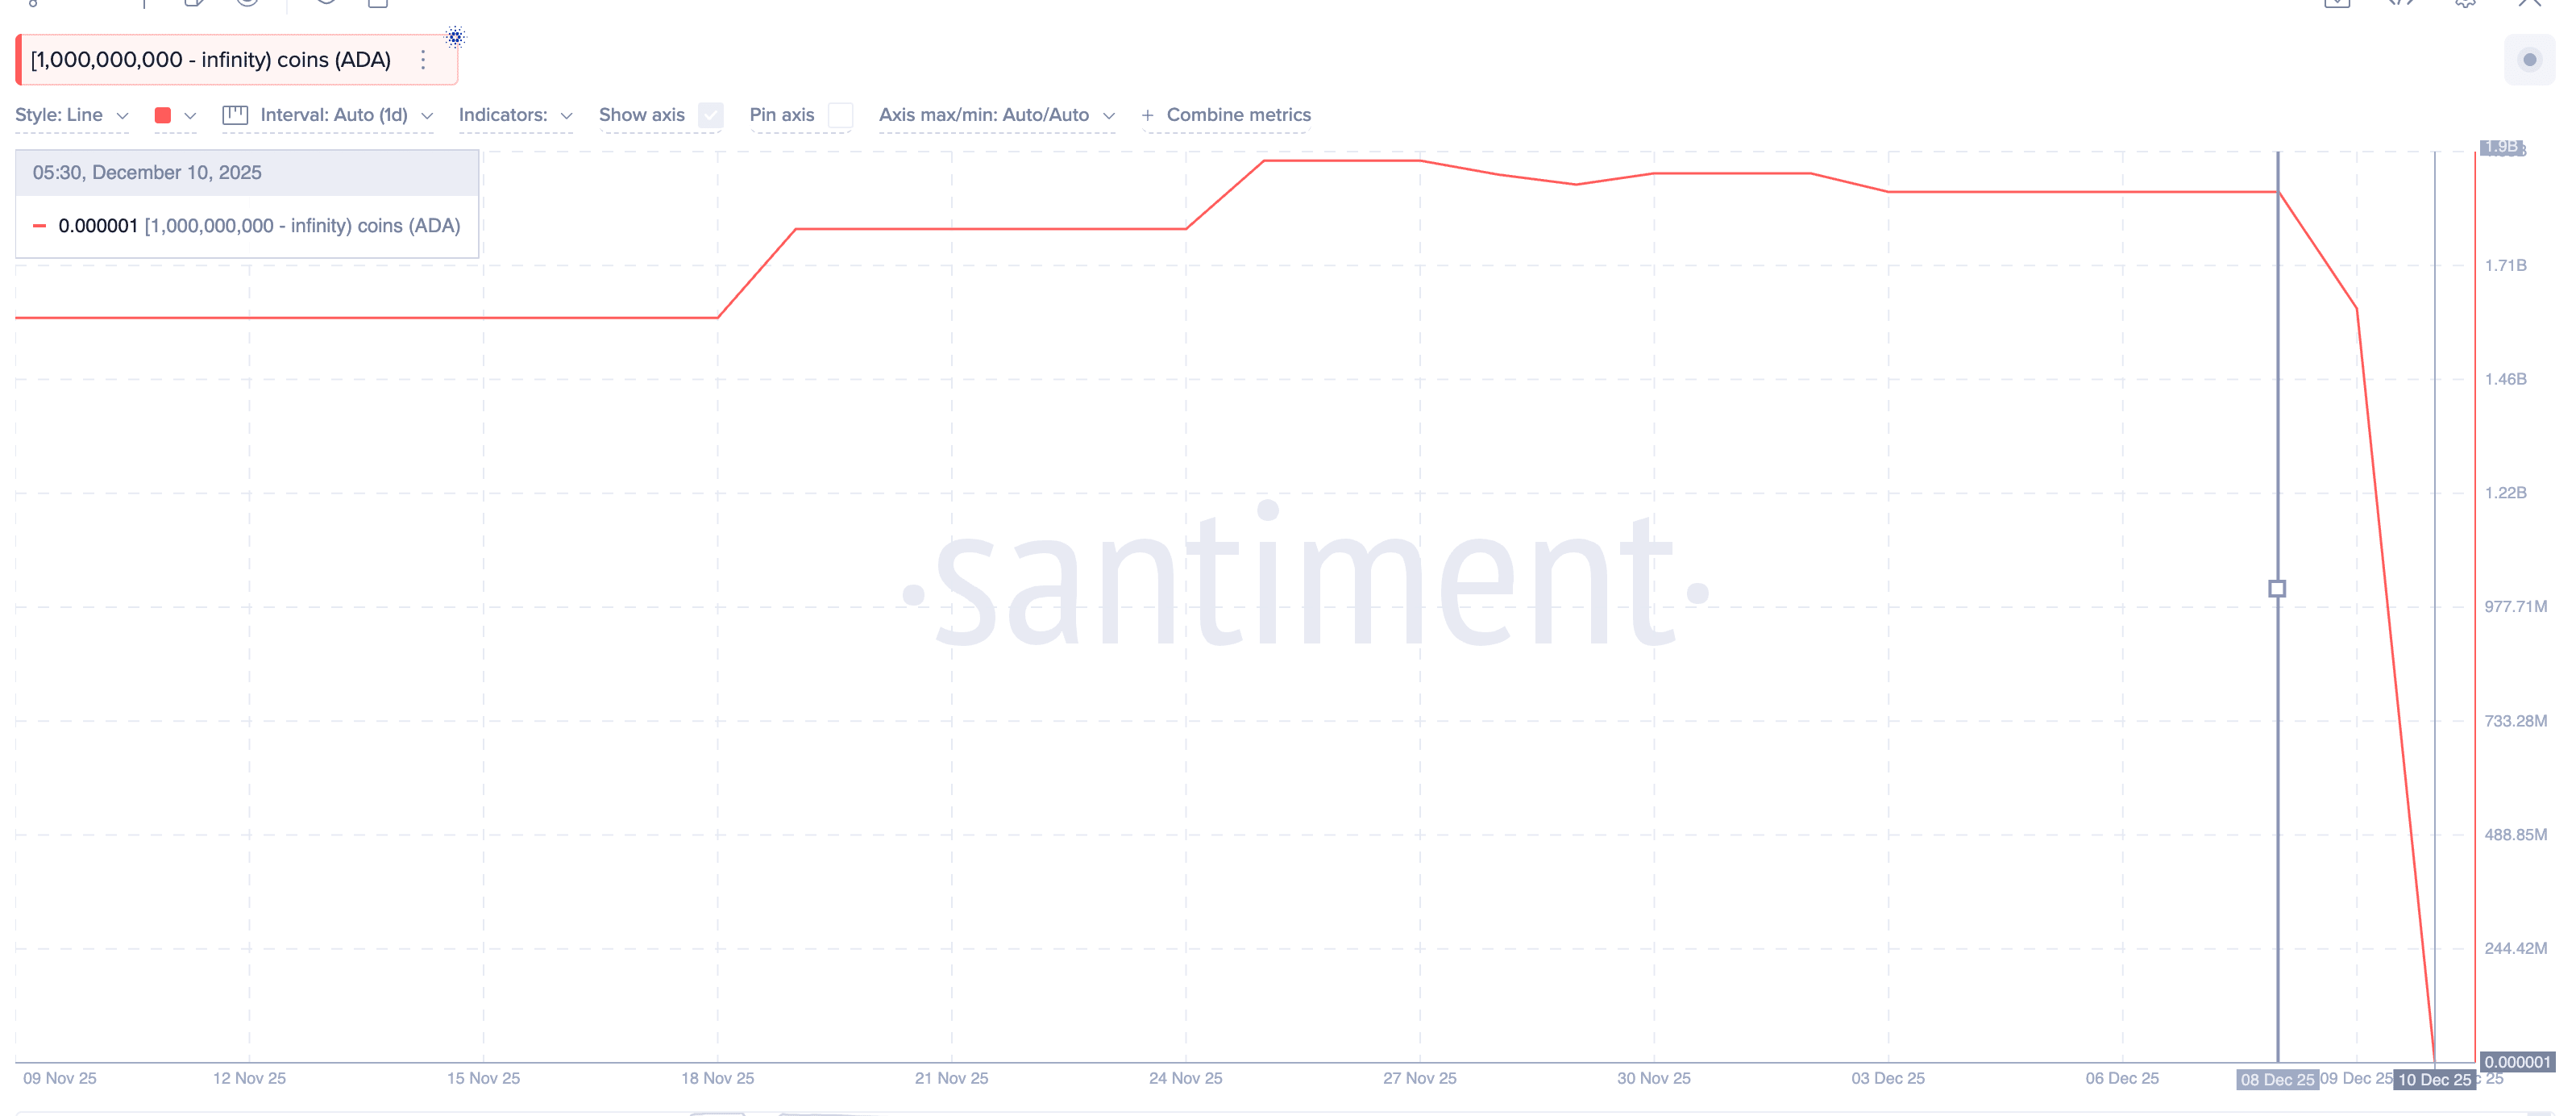
* Whales Exit: The largest Cardano whales (wallets holding over 1 billion ADA) have sharply reduced their exposure since December 8. Their total balance dropped from around 1.86 billion ADA to nearly zero in just two days. Whales do not unload their positions this way unless they expect better entry points at lower levels or wish to use the bounce's strength to exit.
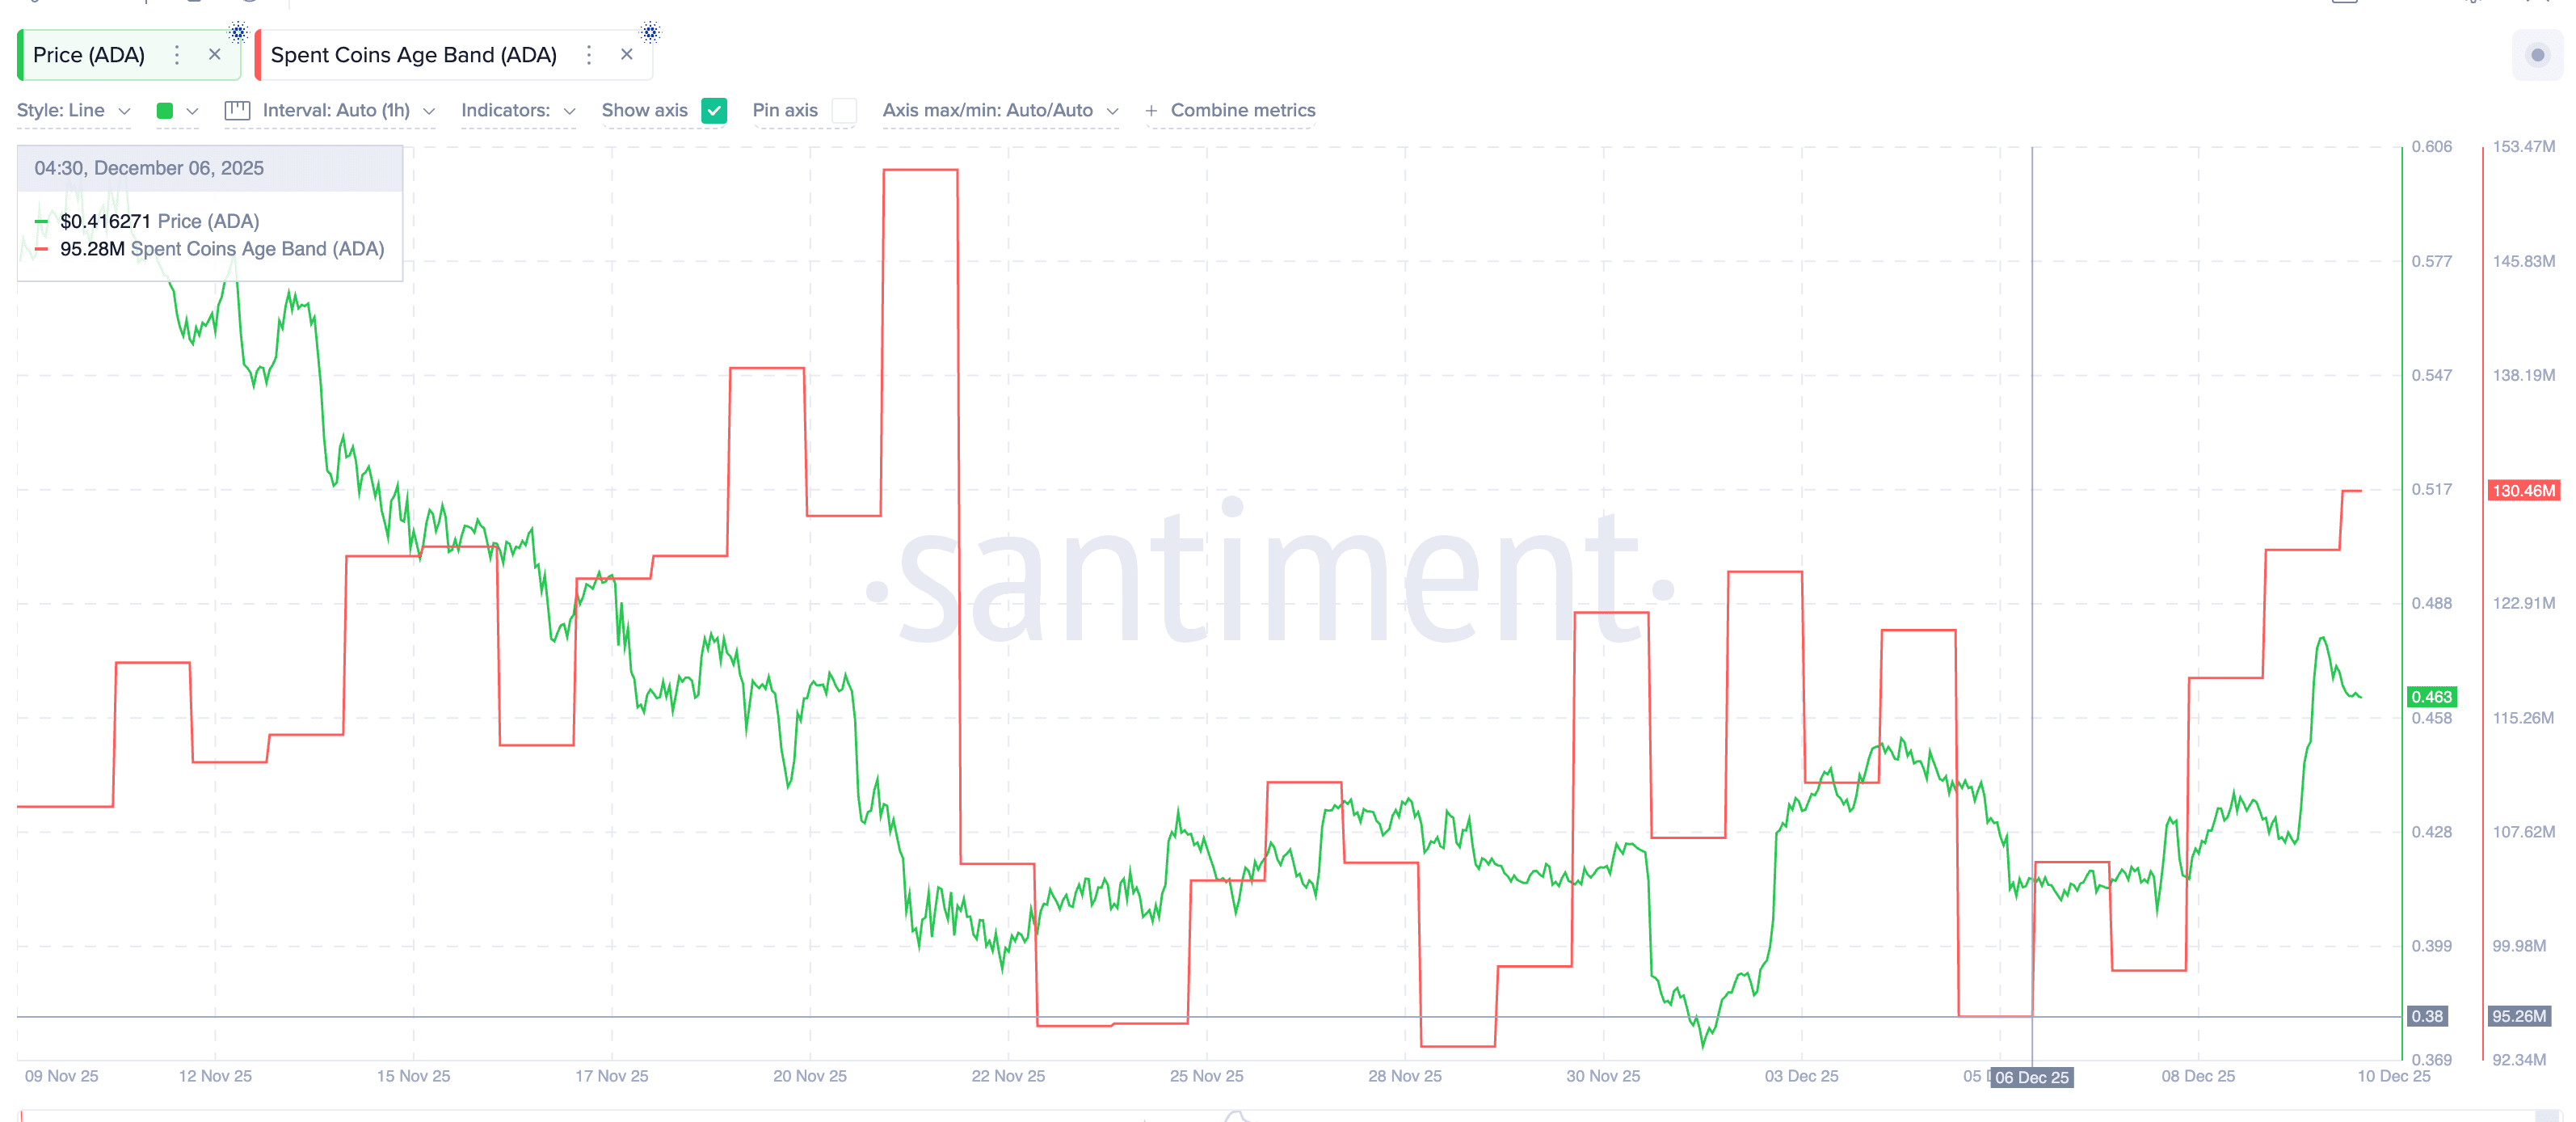
* Spent Coins Jump: The "Spent Coins Age Band" metric tracks the number of ADA coins being moved daily. This number has risen by nearly 37% in four days (from 95.26 million ADA on December 6 to 130.46 million ADA on December 10). This increase indicates that more holders, including long-term holders, may be sending coins to the market.
When whale balances collapse and spent coins rise at the same time, it usually means that traders are using the bounce to sell, not to accumulate.
3. Cardano's price levels show a wider path downwards.
With the chart leaning and on-chain signals pointing towards negativity, the next moves depend on clear levels:
* Bearish Trigger: If ADA's price falls below $0.42, the lower trend line of the bear flag pattern will be broken. From there, the price could slide towards $0.37. If the $0.37 level fails to hold, the full target of the pattern towards $0.25 (a 39% drop) becomes more likely.
* Bullish Invalidation: For bullish traders, the path is narrower but still possible. Cardano must first reclaim the $0.55 level. A daily close above this level would break the upper limit of the bear flag pattern and weaken the bearish setup. After that, stability above $0.60 will show that this "midnight" phase is shifting from mere reset to a more constructive recovery.
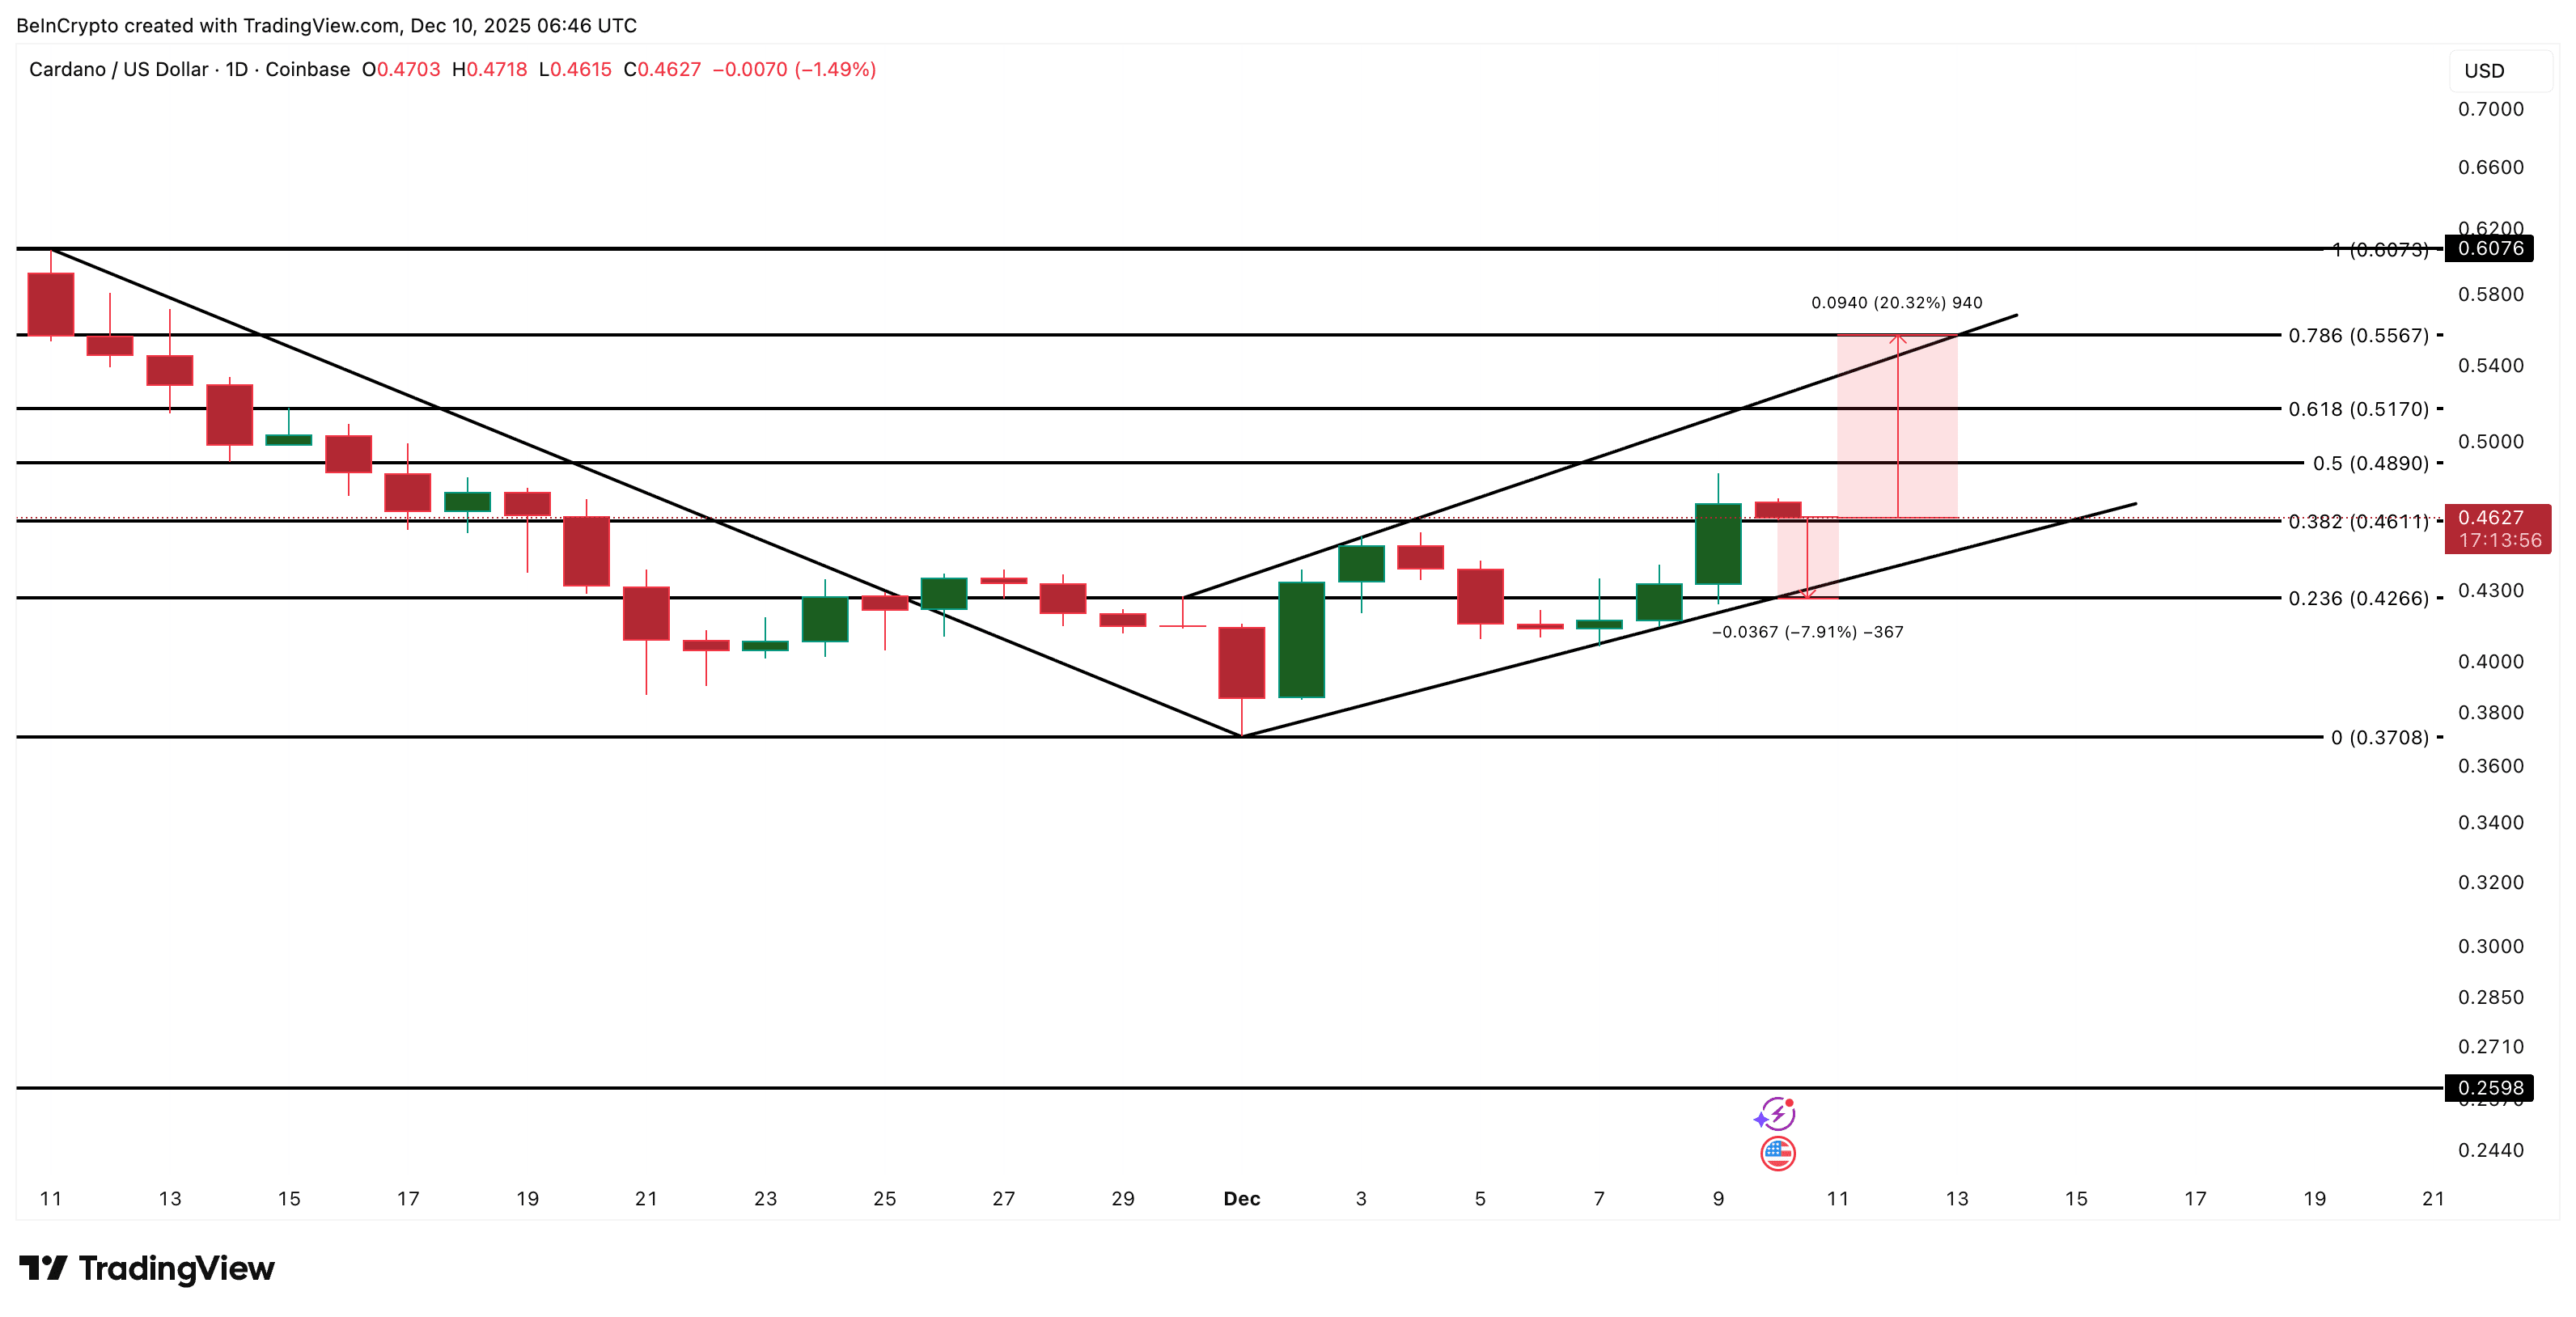
Summary: It only takes a slight drop of 7-8% to trigger a bearish collapse, while a rise of approximately 20% is needed to negate this scenario. With whales exiting and spent coins rising, the weight of the evidence still leans towards the downside (bearish).

