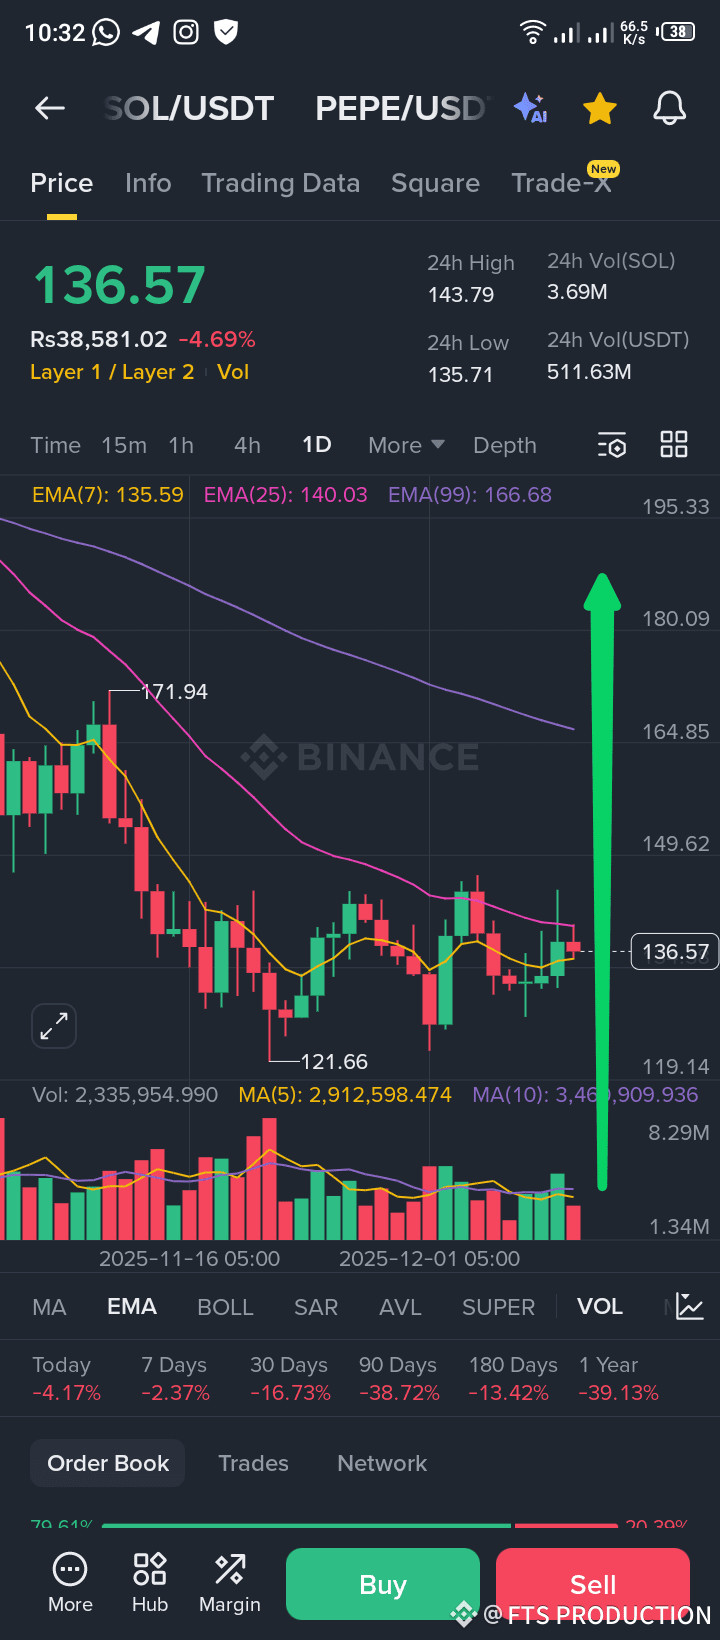
The daily and 4H charts look bearish, but the 1H chart is showing some strength because the EMA50 is above the EMA200. This means Solana might bounce up soon.
On the 15-minute chart, the RSI is low (36.59), which usually signals a possible price reversal. We’ll get a clear confirmation when the 15m RSI moves above 50 — that will show the momentum is turning bullish.
This is a high-probability quick long trade aiming to catch the bounce back towards the 1H structure.
📌 LONG Setup:
Entry (Market): 135.52166 – 136.303708
TP1: 138.25883
TP2: 139.040878
TP3: 140.604975
Stop Loss: 133.566539

SOLUSDT
Perp
137.83
+5.32%