In the volatile cryptocurrency market, technical analysis tools have become indispensable decision aids for traders. The Ichimoku Cloud was invented by Japanese journalist Goichi Hosoda in the 1930s, and after nearly a century of testing in financial markets, this system is particularly suitable for analyzing the trends of cryptocurrencies such as Bitcoin and Ethereum due to its multi-dimensional and forward-looking characteristics. This guide will explain in detail how to apply this classic tool in digital asset trading.
Today, I am sharing the indicator I have been using for a long time. After 3 years of testing, the Ichimoku Cloud predicts market trends relatively accurately compared to other indicators. Below is a detailed explanation of the Ichimoku Cloud and how to use it!

Part One: The core components of the Ichimoku Cloud.
The Ichimoku Cloud consists of five key components, each with its unique calculation method and market meaning:
1. Conversion line (Tenkan-sen, blue line).
· Calculation formula: (Highest price in the past 9 days + Lowest price in the past 9 days) / 2.
· Market meaning: Short-term trend indicator, similar to a fast-moving average.
2. Baseline (Kijun-sen, red line).
· Calculation formula: (Highest price in the past 26 days + Lowest price in the past 26 days) / 2.
· Market meaning: Medium-term trend indicator, reflecting the market's mid-term equilibrium point.
3. Leading span A (Senkou Span A, upper boundary of the cloud).
· Calculation formula: (Conversion line + Baseline) / 2, and shift forward by 26 periods.
· Market meaning: A part of the cloud, reflecting future potential support/resistance.
4. Leading span B (Senkou Span B, lower boundary of the cloud).
· Calculation formula: (Highest price in the past 52 days + Lowest price in the past 52 days) / 2, and shift forward by 26 periods.
· Market meaning: Another part of the cloud, reflecting longer-term market equilibrium.
5. Lagging line (Chikou Span, green line).
· Calculation formula: Shift the current closing price back by 26 periods.
· Market meaning: Compare the current price with the past to confirm the strength of the trend.
Part Two: The Cloud (Kumo) - The Core of the System.
The cloud is the most unique visual element of the Ichimoku Cloud, formed by the area between leading span A and leading span B:
· Thick cloud vs. thin cloud: Cloud thickness reflects market volatility and the strength of support/resistance. A thick cloud indicates a strong support/resistance area, while a thin cloud indicates a weak area.
· Cloud color: When the leading span A is above the leading span B, the cloud is usually green (bullish); conversely, it is red (bearish).
· Relationship between price and the cloud:
· Price is above the cloud: Overall bullish trend.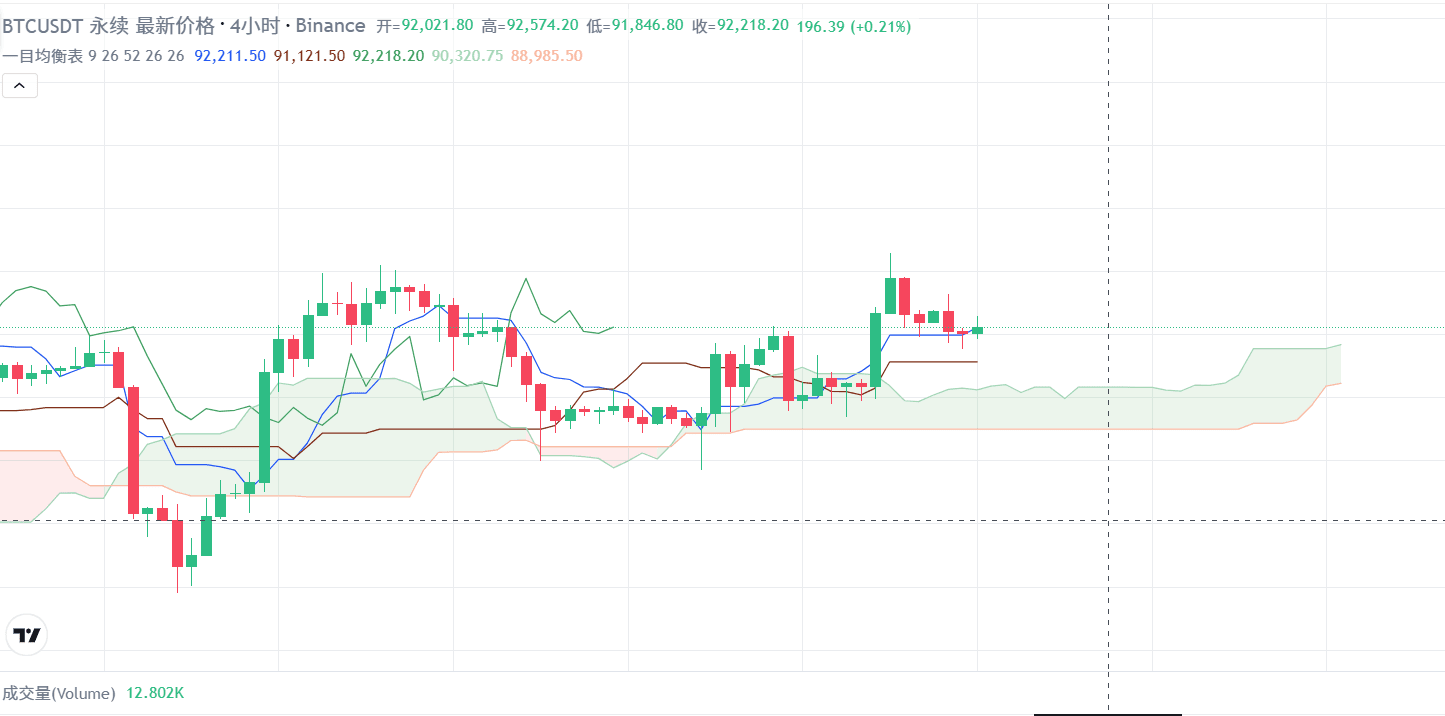
· Price below the cloud: Overall bearish trend.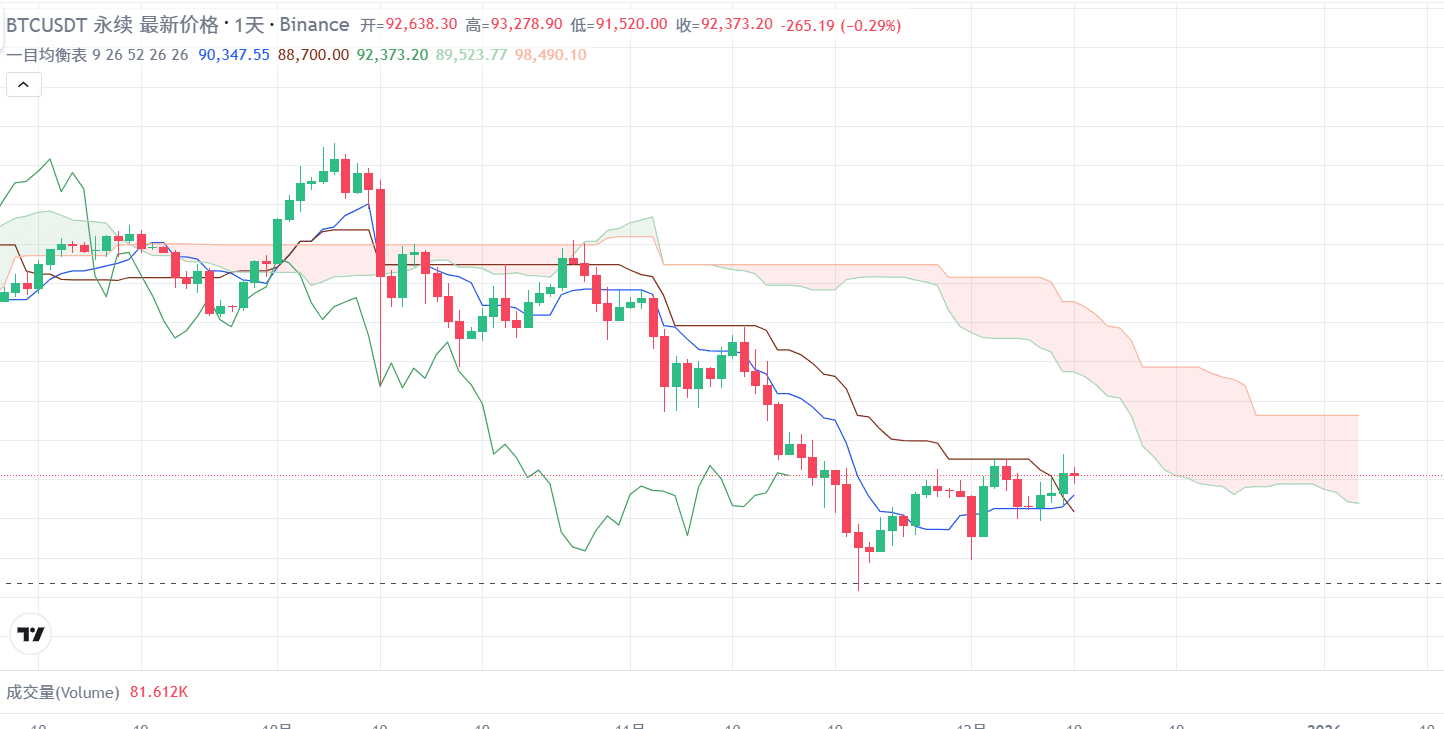
· Price inside the cloud: Trend is unclear, the market is in consolidation.
Part Three: Specific judgment methods in cryptocurrency trading.
1. Trend judgment (multi-layer confirmation).
· Main trend: Observe the relative position of the price to the cloud.
· Medium-term trend: The relative position and crossing of the conversion line and the baseline.
· Trend strength:
· Strong upward trend: Price > conversion line > baseline > cloud.
· Strong downtrend: Price < conversion line < baseline < cloud.
· Trend reversal: Price crosses the cloud while the conversion line crosses the baseline.
2. Buy/sell signal identification.
· Strong buy signal:
1. Price breaks above the cloud.
2. Conversion line crosses above the baseline (golden cross).
3. Lagging line breaks the price level before 26 periods.
4. The cloud itself is green (bullish).
· Strong sell signal:
1. Price breaks below the cloud.
2. Conversion line crosses below the baseline (death cross).
3. Lagging line breaks the price level before 26 periods.
4. The cloud itself is red (bearish).
3. Support and resistance judgment.
· The cloud as dynamic support/resistance: The future cloud provides prospective support and resistance areas.
· Baseline as dynamic support/resistance: In trending markets, the baseline often provides retracement support/rebound resistance.
· Conversion line as a short-term boundary: In a strong trend, the conversion line can be seen as the boundary line for trend continuation.
Part Four: Steps for practical cryptocurrency trading operations.
Step 1: Parameter adjustment (adapt to cryptocurrency characteristics).
Due to the 24/7 trading and high volatility of the cryptocurrency market, traditional parameters may need adjustment:
· Fast trading (hourly chart): Try (7, 22, 44) instead of the standard (9, 26, 52).
· Day trading (15-minute chart): Try (5, 14, 28).
· Long-term holdings (daily chart): Maintain standard parameters or try (20, 60, 120).
Step 2: Multi-timeframe analysis.
1. Determine the main trend (daily chart or 4-hour chart).
· View the relationship between price and the cloud.
· Confirming cloud color and thickness.
2. Look for entry timing (1-hour chart or 15-minute chart).
· Waiting for signal confirmation in small time frames.
· Ensure that the trend in the small time frame is consistent with the main trend.
3. Signal confirmation (at least two conditions need to be met simultaneously).
· Confirming price position.
· Confirming the relationship between conversion line and baseline.
· Confirming the position of the lagging line.
Step 3: Specific trading setup.
Long setup example (using Bitcoin trading as an example):
1. On the daily chart, the price is above the cloud, and the cloud is green.
2. The 4-hour chart shows the conversion line crossing above the baseline.
3. Price on the 1-hour chart retraces to the baseline or near the upper boundary of the cloud.
4. Set buy orders above the support area.
5. Stop-loss setting: Below the lower boundary of the cloud or recent volatility low.
6. Initial target: One or 1.5 times the cloud thickness.
Short setup example:
1. On the daily chart, the price is below the cloud, and the cloud is red.
2. The 4-hour chart shows the conversion line crossing below the baseline.
3. Price on the 1-hour chart rebounds to the baseline or near the lower boundary of the cloud.
4. Set sell orders below resistance areas.
5. Stop-loss setting: Above the upper boundary of the cloud or recent volatility high.
6. Initial target: One or 1.5 times the cloud thickness.
Step 4: Risk management.
· Position management: Risk per trade should not exceed 1-2% of account funds.
· Stop-loss strategy: Set stop-loss outside the cloud boundaries to avoid market noise triggering.
· Partial take-profit:
· First target: One times the cloud thickness, reduce position by 50%.
· Second target: 1.5-2 times the cloud thickness, reduce position by 30%.
· Remaining position tracking stop-loss to capture larger trends.
Part Five: Combine with other indicators to enhance effectiveness.
1. Volume confirmation: Important signal points should have increased volume support.
2. RSI/MACD divergence confirmation: When the Ichimoku Cloud shows a signal, if there is also a divergence phenomenon, the reliability of the signal is higher.
3. Key levels coincide: The cloud boundary coinciding with previous highs/lows or Fibonacci levels strengthens support/resistance effects.
Part Six: Special considerations for the cryptocurrency market.
1. 24/7 market characteristics: Unlike traditional markets, there is no need to consider overnight gaps, but be aware of major news release times.
2. Extremely high volatility: Cloud thickness may change sharply, requiring closer monitoring and adjustment of stop-loss.
3. Market manipulation risk: Low market cap tokens may experience abnormal volatility, should mainly apply to mainstream coins (BTC, ETH, etc.).
4. Price differences across multiple exchanges: Be aware that price differences on different exchanges may affect signal accuracy.
Common mistakes and how to avoid them.
1. Overtrading: Avoid chasing every crossover signal in small timeframes.
2. Ignoring the overall trend: Do not trade against the trend when it is clear.
3. Over-optimization of parameters: Do not adjust parameters excessively for perfect historical data fitting.
4. Isolated use: Avoid relying solely on the Ichimoku Cloud while ignoring market fundamentals and other technical signals.
Summary: Build a systematic trading process.
Successfully applying the Ichimoku Cloud for cryptocurrency trading requires:
1. Patiently wait: Only trade high-quality signals, avoid forced trades.
2. Multi-layer confirmation: At least two timeframes and two or more signal components confirm.
3. Strict risk control: Each trade should have a clear entry, stop-loss, and take-profit plan.
4. Continuous learning: Record each trade and analyze the reasons for success and failure.

The Ichimoku Cloud is not a crystal ball predicting the future, but a systematic framework that helps traders objectively assess market bullish and bearish forces, identify potential trends and key positions. In the highly emotional cryptocurrency market, this systematic analytical method can help traders maintain discipline, reduce the influence of subjective biases, and thus improve the success rate of long-term trading.
Remember, no technical indicator is 100% accurate, and the Ichimoku Cloud is no exception. Combining it with reasonable risk management and strict trading discipline is key to sustained profitability. Before starting real trading, it is recommended to practice on a demo account for at least 1-2 months to familiarize yourself with various performance patterns of this indicator in the cryptocurrency market.
Written by: Jiang Feng Capital.

