The current price of Bitcoin is fluctuating around 92300 USD. The market, after digesting the Federal Reserve's latest interest rate decision, failed to maintain the upward momentum and instead faced pressure due to an internal ‘hawkish’ interpretation of the policy, with prices suppressed within the key ‘fragile range’ below 95000.
Yesterday, I suggested everyone to position long orders around 89500 to 88500. This morning, it approached near 93540, with more than 4000 points in between, which is also our second target near 94000. Currently, there is resistance at the upper boundary around 92300 and 92800, as well as resistance above around 94000 to 96250. Everyone should timely reduce some positions! There is support near the Fibonacci extension line around 91500, and support from the Ichimoku cloud layer around 90500, along with support at the bottom of the cloud near 89000 and support around 88000! However, it is not recommended to blindly enter long positions. Instead, it is necessary to take profits in batches from the long positions around 89500 and ensure a breakeven loss before attempting to gamble again!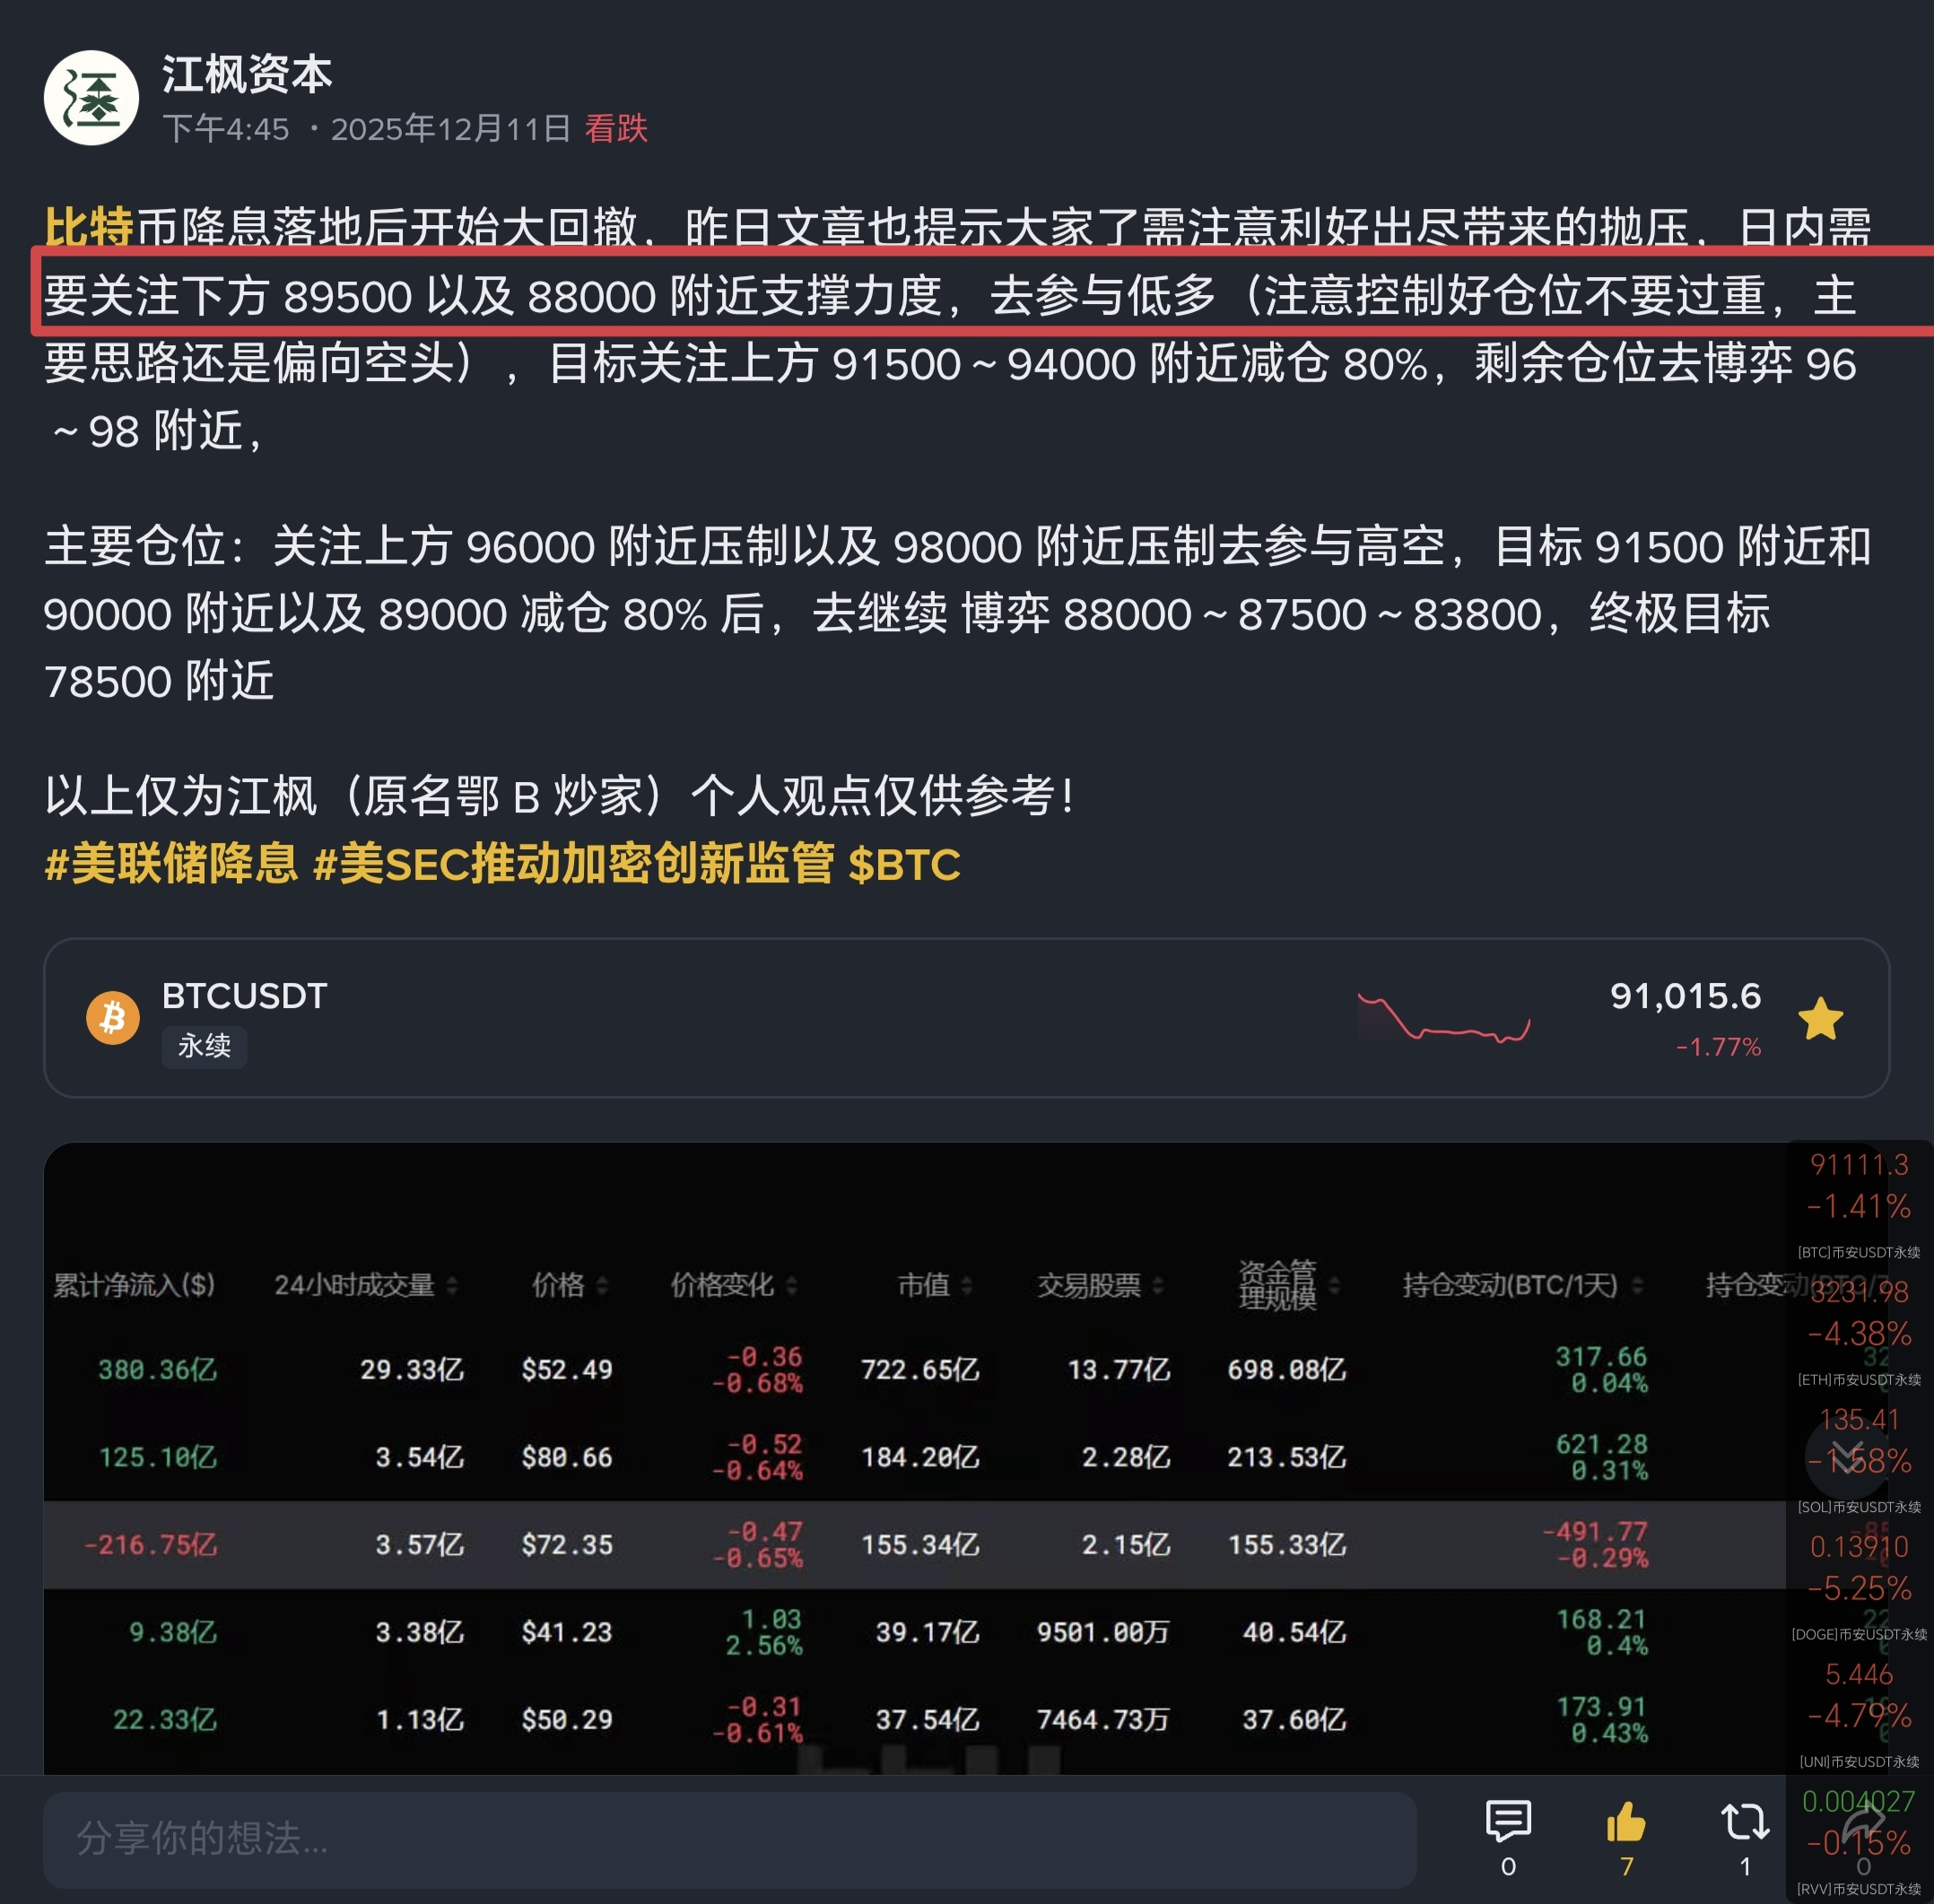
I. Macro fundamentals analysis: Rate cuts overshadowed by hawkish sentiment
This rate cut by the Federal Reserve not only failed to boost the market but also intensified volatility, stemming from the contradictory policy signals and the shift in market risk appetite.
1. The 'divided' Federal Reserve and hawkish rate cuts: Although the Federal Reserve approved a 25 basis point rate cut on December 10, the 9:3 vote revealed serious internal divisions over inflation resilience and economic outlook. This rate cut has been labeled 'hawkish' by the market, and Chairman Powell's warnings about inflation stickiness and a weak labor market have weakened market expectations for sustained easing in 2026. For assets highly sensitive to liquidity, like Bitcoin, the uncertainty of future monetary policy paths poses direct pressure.
2. Risk assets under general pressure: The cautious sentiment in the macro environment is reflected in the tech stock sector. Oracle's stock plummeted due to concerns over AI investment returns, dragging down the Nasdaq and triggering synchronized deleveraging sell-offs in tech stocks and cryptocurrencies. This indicates a contraction in current market risk appetite, with funds flowing out of high-volatility assets. Data shows that within hours of the interest rate decision, approximately $440 million in positions were liquidated in the cryptocurrency market.
3. Contradictory signals from the funding side:
· Institutional demand cooling: The spot Bitcoin ETF saw a net outflow last week, with approximately $1.05 billion worth of Bitcoin redeemed, indicating that institutional investors are becoming cautious in the short term.
· Long-term holders taking profits: On-chain data shows that long-term holders (those holding for over a year) are engaging in large-scale profit-taking, with daily realized profit peaks reaching $1.3 billion, while realized losses have surged to $555 million per day, hitting the highest level since the FTX collapse in 2022. This 'top buyers surrender' combined with the sell-off from long-term holders creates ongoing selling pressure.
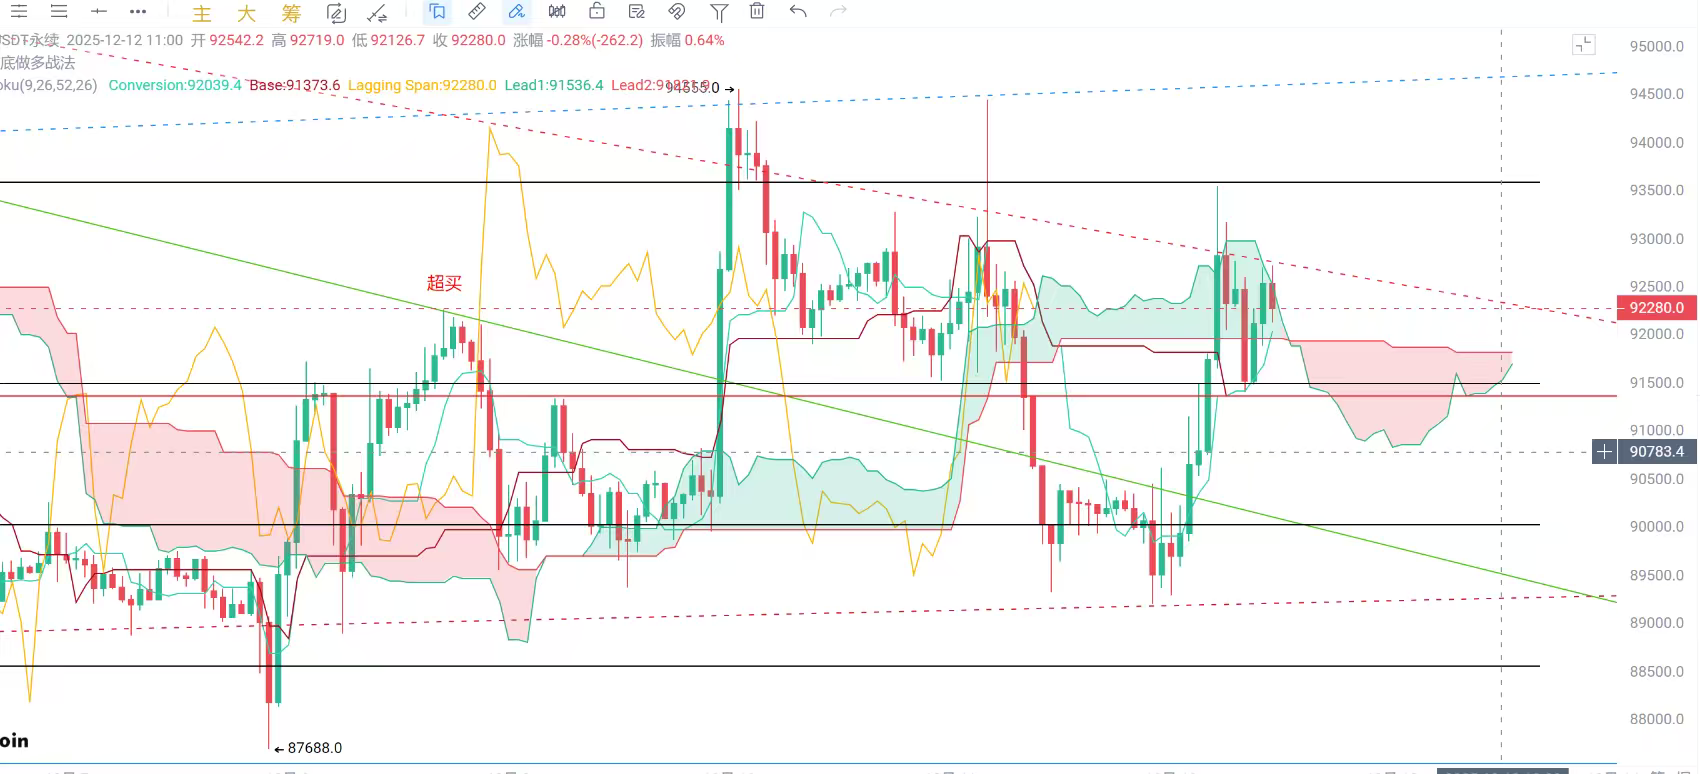
II. Technical analysis: The life-and-death struggle at key support zones
Prices are fluctuating repeatedly within a key range, and a directional breakout is imminent.
1. Core long and short range
The current market structure is clearly centered around two core price ranges, and their gains and losses will determine the subsequent medium-term trend.
· Upper core resistance area: around $94,000. This area has been a key ceiling that has suppressed price rebounds multiple times recently and is also a short-term dividing line between long and short positions. If it can effectively break through and stabilize, the price is expected to test $96,000 or even higher.
· Lower core support area: $88,000 - $89,000. This area converges with the upward trend line, Fibonacci retracement level, and previous liquidity pool, forming the 'Maginot Line' that bulls must defend. Once lost, the market may swiftly slide towards $85,000 to seek support.
2. Market structure and sentiment indicators
Potential for 'final consolidation': Some market analysts describe the current decline as a 'final consolidation', which aims to clean out weak holders through violent fluctuations before a major trend reversal, building momentum for future movements.
Cautious derivatives market: A noteworthy divergence is that the recent rebound in Bitcoin prices is mainly driven by spot demand rather than leveraged speculation. The open interest in the futures market continued to shrink during price increases, indicating that derivatives traders are cautious, and sustained bullish momentum may be lacking.
III. Today's trading strategy is as follows
Based on the above analysis, the current market is in a high-risk, high-volatility directional phase. It is advisable to rely on key support and resistance levels and adopt a cautious range trading strategy until prices choose a clear direction.
Intraday dividing line between long and short: $90,500
Bearish strategy (upper range under pressure) aggressive entry (testing position layer 1)
· Entry range: $92,300 - $92,800. Consider when the price rebounds to the lower edge of the core resistance zone and shows signs of stagnation.
· Stop-loss setting: above $93,600. To prevent a strong breakthrough of the price through the consolidation range.
· Target price levels: First target $90,500 (dividing line), second target $88,800 - $89,000 (core support area). It is recommended to reduce 80% of positions before aiming for $87,500 and the ultimate target near $78,500!
Main positions:
Conservative stance: Open a long position at 89,500; reduce 50% of the position at 92,300 and wait for stabilization near 94,500 before using 30% of profits to add to the position! Watch near 96,000; patiently wait for support and resistance around 96,200 and 97,000-98,000 before laying out short positions, targeting the following support levels: 91,500-90,500-89,500-88,000-87,500-83,800-78,500, and take profits in batches based on your own position!
The market is highly volatile, and all trades must set stop-losses. If prices fall below $88,000 with significant volume or break and stabilize above $94,500, it indicates a breakdown of the current consolidation pattern, and one should promptly assess the original strategy and go with the trend.
Author: Jiangfeng Capital (formerly Hubei B speculator)

