First:
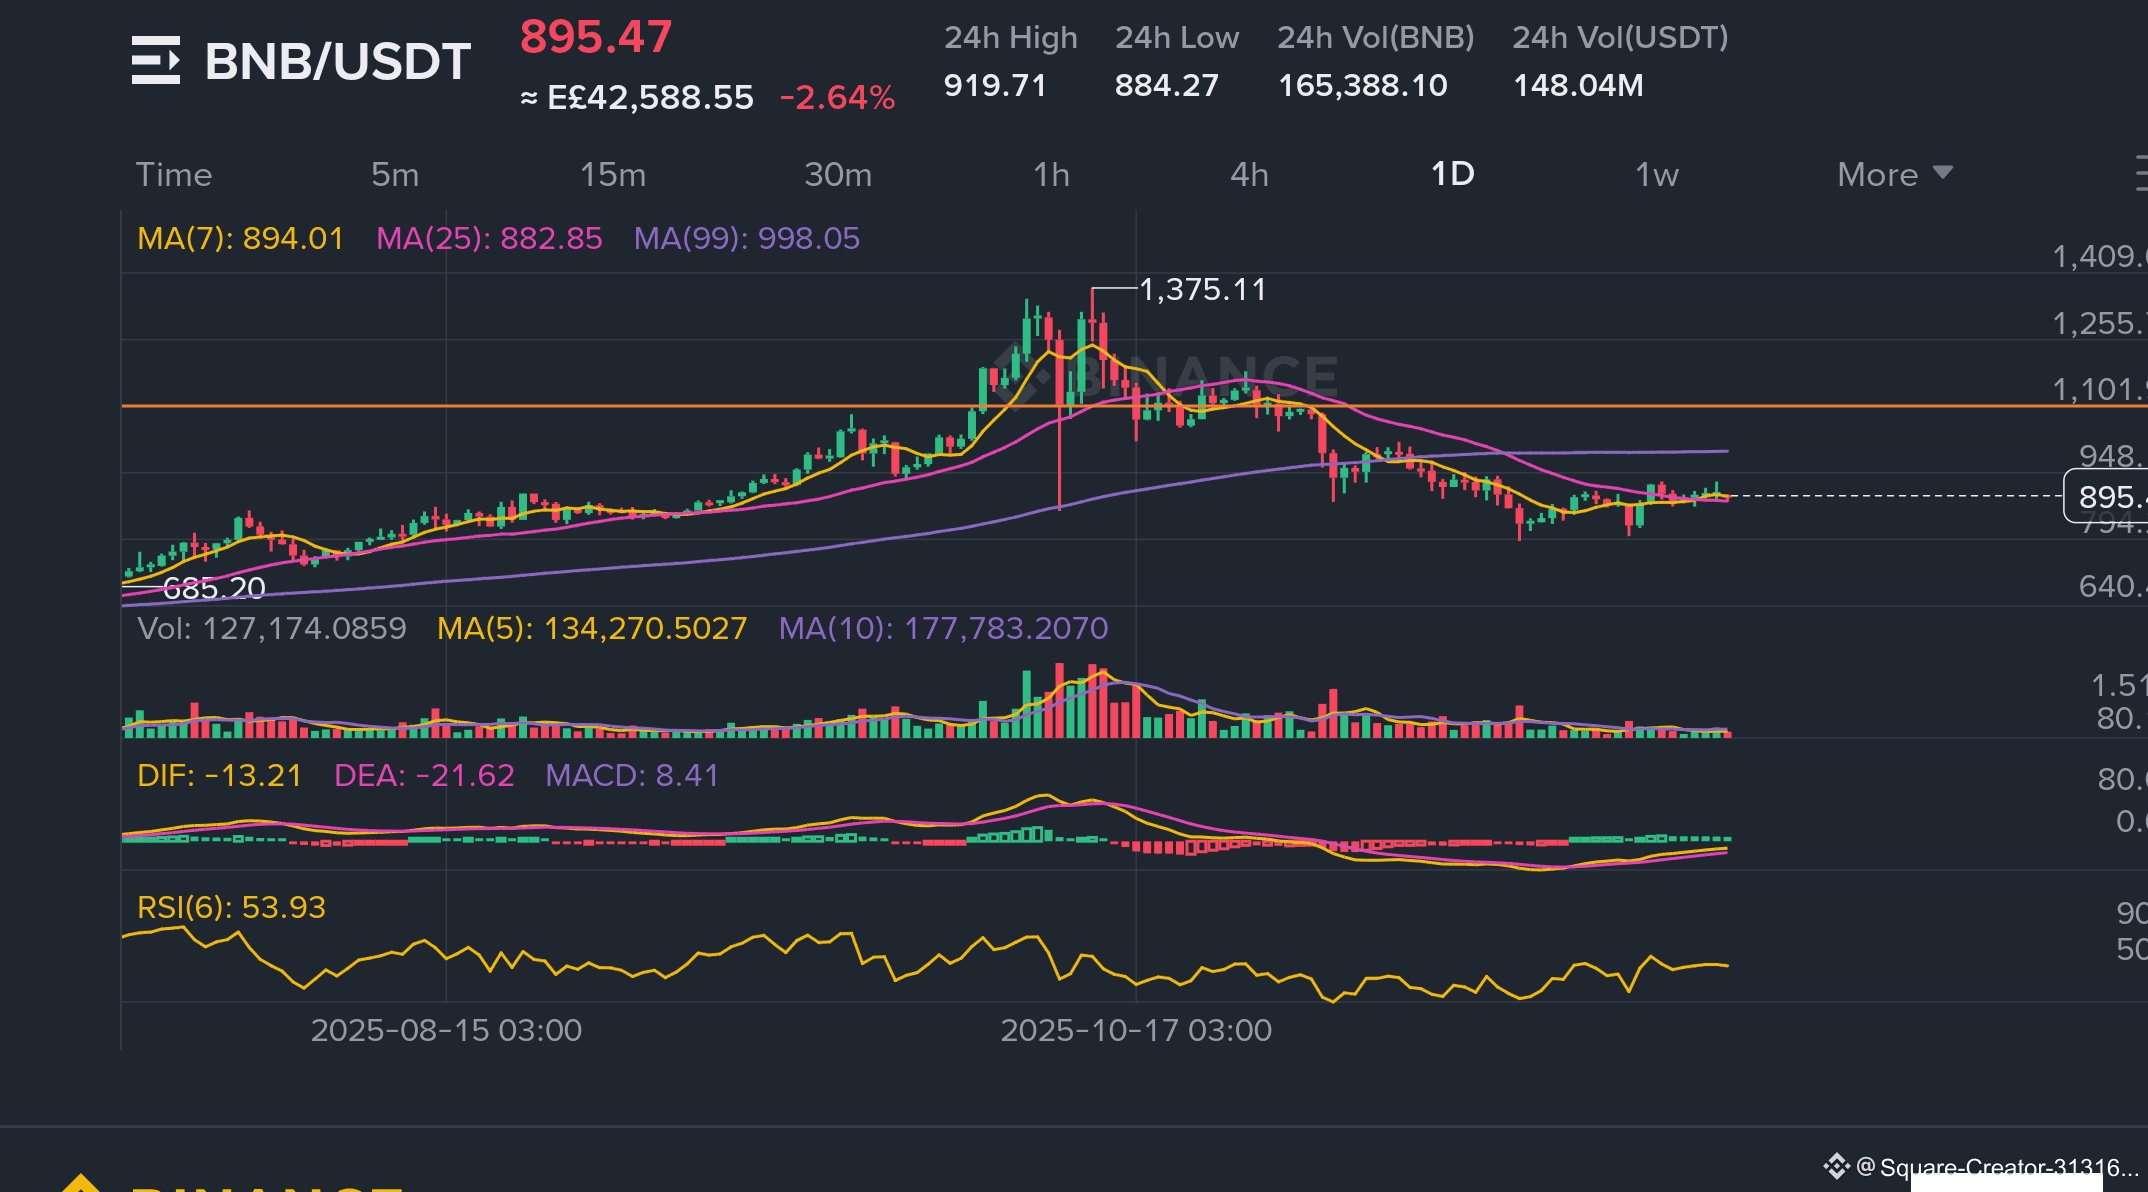
1️⃣ Price is currently around $895
This places BNB in a neutral zone between:
A very strong support at $860–$880
A very strong resistance at $948–$970
Right now, the price is “stuck” between these two zones.
2️⃣ Moving Averages (MA)
MA7 (yellow) ≈ $894 → price slightly above it = weak bounce
MA25 (pink) ≈ $882 → price above it = slight positivity
MA99 (purple) ≈ $983 → price is far below it = major trend still bearish
💡 Summary:
Short-term signals = “bounce”
Long-term trend = still downward
3️⃣ MACD
DIF = negative
DEA = negative
Histogram = still below zero
But the two lines are starting to converge → early signs of slowing momentum,
not a confirmed reversal.
4️⃣ RSI = 53
This means:
No overbought
No oversold
Completely neutral
5️⃣ Volume
Volume is very weak compared to previous strong moves.
This means:
🔹 The current bounce has no real buying power
🔹 The trend is unclear — the market is waiting for a big move
🔥 Second: What does all of this mean? (Clear technical interpretation)
BNB recently experienced:
A sharp drop down to $791
A bounce up to $920
A mild pullback to $880–$895
This tells us that the market is retesting support.
👉 If the market were truly ready for a strong recovery, we would see:
Strong green candles
High volume
A breakout above MA99 at $980
None of these are present yet.
👉 So for now, the market is in a phase of accumulation / consolidation
Waiting for a catalyst — either upward or downward.
🔥 Third: Possible scenarios (very clearly)
Scenario 1 — Bullish move (40%)
A real upward move will only happen if:
✔ Price breaks the $948–$970 resistance
A daily close above $970 would target:
$1010
$1050
$1100 (the level where price was rejected previously)
But at the moment, there is no strong volume and no positive MACD,
so this scenario is weaker.
Scenario 2 — Sideways movement (30%)
Price may continue moving between:
$880 support
$920–$940 resistance
For several days or even a week.
This often happens before a “big breakout”.
Scenario 3 — Drop toward $860 then $820 (30%)
This scenario is still valid because:
The major trend is bearish
Volume is weak
Price failed to break $948
Large MAs are above the price
If price breaks below $880,
the next target becomes:
$860 (strong support)
If $860 breaks →
$820 – $790
Which is the scenario we warned about earlier.
🔥 Final Summary (as clearly as possible)
The market is not clearly bullish
and not strongly bearish at this moment.
It is in a fight zone.
If price:
⬆ Breaks above $970 → strong bull
ish move
⬇ Breaks below $880 → another drop
Currently: The market leans slightly toward bearish,
but there is still a window for bullish recovery if strong green candles appear.
