Naked k looks at the market, hitting the essence directly, news can be misleading, but k-lines do not lie.
Last night, the boots dropped, interest rate cuts were realized, and the big pie also punctured upwards as expected. There haven't been any good news recently, and on the 19th, there will be a Bank of Japan interest rate hike, which is negative news. Let's boldly short, as the market also points in the direction of shorting. Please see today's market analysis below; I won't talk about the weekly chart, let's start directly from the daily chart:
1. Daily chart, once again, it shot a needle towards the weekly pressure of 94261, closing as an inverted hammer, also known as a tombstone line. The appearance of this k-line below the pressure level is a definite signal to short. Yesterday I mentioned that the daily line was a medium bullish line; placing a short order was still somewhat on the left side, but with today's line closing, if you don't short, you're not doing justice to yourself. Yesterday in the group, I provided several coin positions, and all the orders were filled, all making a profit.
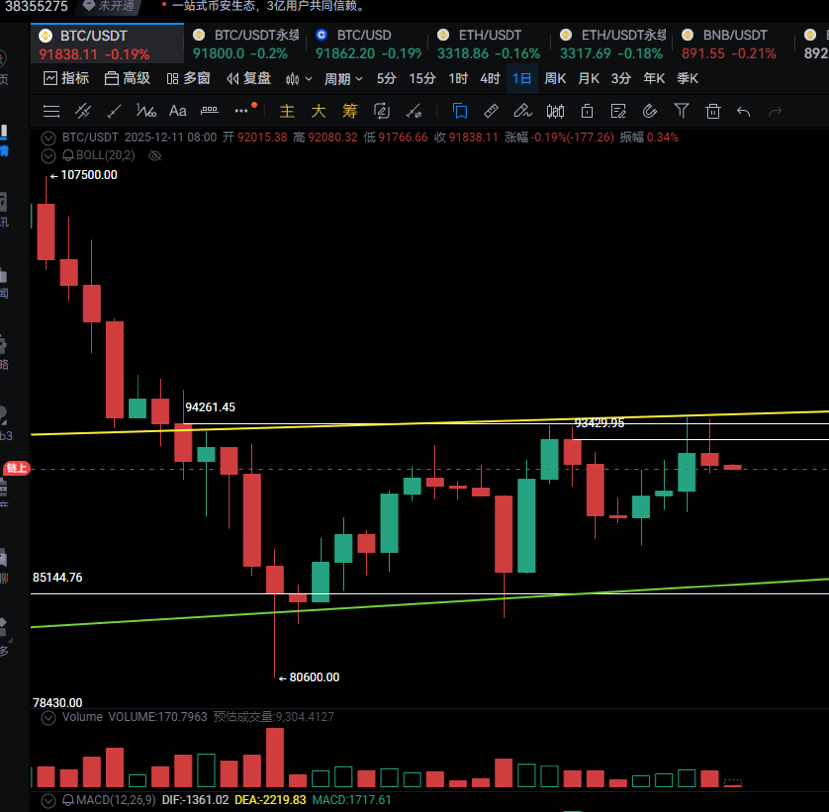
Second, on the 4-hour chart. It looks worse, resembling a double top breakdown. I hope it rebounds to give a short opportunity. I don't want to chase the short position now either. Last night, I didn't dare to place an order to short for safety; the price dropped too much. I will give three key levels: 92900, 93350, 93750. Those wanting to short should wait at these three positions.
Aaron mentioned multiple times in August that 120,000 is the major peak of this cycle, urging people to escape the top (the pinned article can be checked). He also provided points for bottom fishing: 82550 (monthly support), 80000 (round number), 78430 (weekly support). Historical articles can all be checked; I have never deleted or modified any article. Including each time I find support and resistance levels, you can compare with your own system. Is it better to use moving averages, Bollinger Bands, MACD, KDJ, or is naked K better? Simplicity is the ultimate sophistication. In my opinion, besides MACD for referencing divergences, other indicators are useless.
The market is not short of other technical schools, such as Chen theory and wave theory, but none of these are as useful as the naked K system. First, let's talk about Chen theory. The Zen master is long gone and cannot come out to answer everyone's questions. Who dares to say that what they learned is correct? That's how the saying 'a thousand people have a thousand interpretations of Chen' came about. Moreover, the concepts in Chen theory can be explained using naked K; things like the central pivot and divergence are just combinations of top and bottom structures plus shapes (triangles, wedges, flags, boxes, etc.). The key question is whether the Zen master has any practical achievements to show. I heard that he was still in debt after his death. Another point is that Chen theory does not consider trading volume, only studying K lines. Trading volume is capital; price rises and falls are driven by capital. Can you ignore the essence of things?
Now, let's talk about wave theory. Not every cryptocurrency and every cycle follows wave theory, especially those low-market-cap altcoins. They can go straight up and down in a V shape. Can you still expect them to follow the standard 5-wave pattern? Even Bitcoin does not follow wave theory in every cycle. The fundamental thing is to observe the K lines. If the volume is high and there are characteristics of a stagnation top, it’s obvious. Still expecting Bitcoin to go above 130,000? That's just burying your head in the sand and ignoring the road. If you separate volume and price, you are just following the waves you drew. I’m referring to that so-called master, who led the entire community to liquidation on October 10, still using wave lines to say ZEC would go to 10,000 dollars. Now, everyone can see the trend; the double top structure has already broken down. It pulled back to the level yesterday and continues to fall. We’ll see below 100.
Also, there's the recently popular Wyckoff. To be honest, it's still quite good. I've looked at it, but haven't finished it mainly because there are too many terms in it, many English abbreviations. I graduated from a 211 university, but now that I'm older, I can't remember those terms. I forgot what I read earlier when I see it again later, so I simply stopped looking. Wyckoff primarily discusses accumulation and distribution, which is essentially studying the characteristics of top and bottom structures. Our naked K system mainly does this; it just uses different terminology.
So, despite the comparisons, the naked K system is still the best; simplicity is the ultimate sophistication. In the future, I might not be able to update my articles daily. For those looking to layout spot in a bear market next year or trying to escape the peak in a bull market, check my homepage, find me on X, and for those playing with coins, as long as you’re not a novice, you know there is a better place.