
The market structure of Solana (SOL) is entering a tense phase, due to thinning liquidity, rising leverage, and conflicting signals between institutional fund flows and the derivatives market.
While the price trend remains within familiar ranges, the fundamentals present a more complex situation, with traders closely watching for signs of weakness or a sharp reversal.
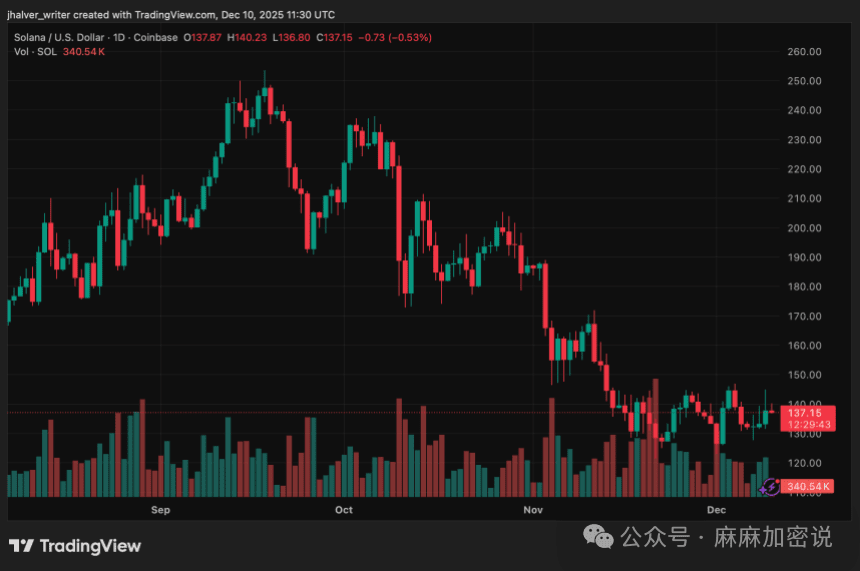
Recently, the price of Solana has fluctuated between $128 and $145, with a brief rebound bringing it close to the upper limit of that range. However, liquidity indicators suggest that a deeper adjustment is brewing. Analysts point out that these situations often herald the arrival of a turning point, although they may exacerbate volatility in the short term.
SOL liquidity has dropped to bear market levels.
On-chain data shows that Solana's 30-day realized profit-loss ratio has remained below 1 since mid-November. This pattern of losses exceeding profits typically signifies liquidity contraction, similar to historical bear market phases.
Analysts at Altcoin Vector describe the current situation as a 'complete liquidity reset', a process that typically takes several weeks to resolve.
This context aligns with observations from SynFutures, where the team noted that realized losses, a decline in futures open interest, and the dispersion of liquidity pools are contributing factors.
Market makers have also withdrawn, leading to a reduced order book size, while actual volatility is rising. This makes the market highly sensitive to sharp fluctuations, especially near key liquidation areas.
There is a significant risk around $129; if the price retests this area, nearly $500 million in long positions will be forcibly liquidated. In just the past 24 hours, SOL contracts have lost $15.6 million, and the market remains susceptible to chain reactions.
Similarly, forex balances continue to decline, with spot ETFs absorbing over $17 million this week, indicating that despite overall market pressure, there is still capital inflow.
Divergence in derivative and spot trading activity has emerged, leading to increased market volatility.
Derivative product data shows a cautious but active trading environment. Open interest has rebounded to over $7.2 billion, growing in tandem with the daily trading volume's rebound.
This accumulation behavior occurring during a stable price phase usually indicates that the market is preparing for a larger trend. In recent days, the long-short ratio has turned bullish, and the financing rate remains positive, although traders are increasingly sensitive to macroeconomic catalysts.
The situation in the spot market is markedly different. Lack of liquidity and deep cycle reset indicators show that the sell-off is nearing its end, rather than actively expanding. This phenomenon of high derivative trading activity while spot liquidity weakens usually indicates that volatility will sharply rise.
The market awaits a cycle change, with key price levels for Solana approaching.
From a technical standpoint, Solana's price continues to hover between established resistance levels. The resistance zone at $145 has repeatedly hindered attempts to break upwards, while the support level around $135 and deeper support near $129 are crucial for traders concerned with liquidation risks.
Momentum indicators are stabilizing, and the MACD indicator is approaching a potential bullish crossover. Analysts note that historically, after a liquidity reset, once market conditions improve, rapid increases often occur; however, the exact timing remains uncertain.
Currently, Solana is at the center of a struggle between cautious sentiment, tightening liquidity, and stable institutional capital inflows. These opposing forces will ultimately determine whether the market recovers or volatility intensifies, likely depending more on the pace of liquidity restoration rather than price trends themselves.
