Solana (SOL) is currently trading around the mark of 130 USD on Thursday evening, after continuing to be rejected at the upper resistance line of the descending wedge pattern. Market sentiment has weakened, especially following the Fed's hawkish interest rate cut decision, which has increased downward pressure on SOL. At the same time, on-chain data shows that selling pressure is dominating, signaling a risk of deeper declines in the short term.
Fed cautiously cuts interest rates, putting pressure on risk assets
The cryptocurrency market collectively weakened after the Federal Open Market Committee (FOMC) meeting early Thursday. As expected, the Fed cut interest rates by 25 basis points, bringing the range down to 3.50%–3.75% after two days of policy meetings, while signaling a possible pause in easing in January.
In addition, policymakers' forecast of only one rate cut of 0.25% in 2026 — similar to the outlook published in September — is causing market expectations to cool, creating short-term pressure on the group of risk assets. The rate cut carries a 'hawkish' tone along with the Fed's cautious stance triggering risk-averse sentiment, dragging assets like Bitcoin, Ethereum, Ripple, and Solana down during Thursday's trading.
On-chain data shows bearish signals
Data from CryptoQuant, shown in the chart below, indicates that selling pressure on Solana is increasing. The Taker CVD (Cumulative Volume Delta) of SOL switched to negative territory on Wednesday. This is an indicator measuring the difference between buying and selling volumes over the last three months. When the 90-day CVD remains positive and rises, the market enters the 'Taker Buy Dominant' phase. Conversely, when the indicator turns negative and continues to decline, it reflects the 'Taker Sell Dominant' state.
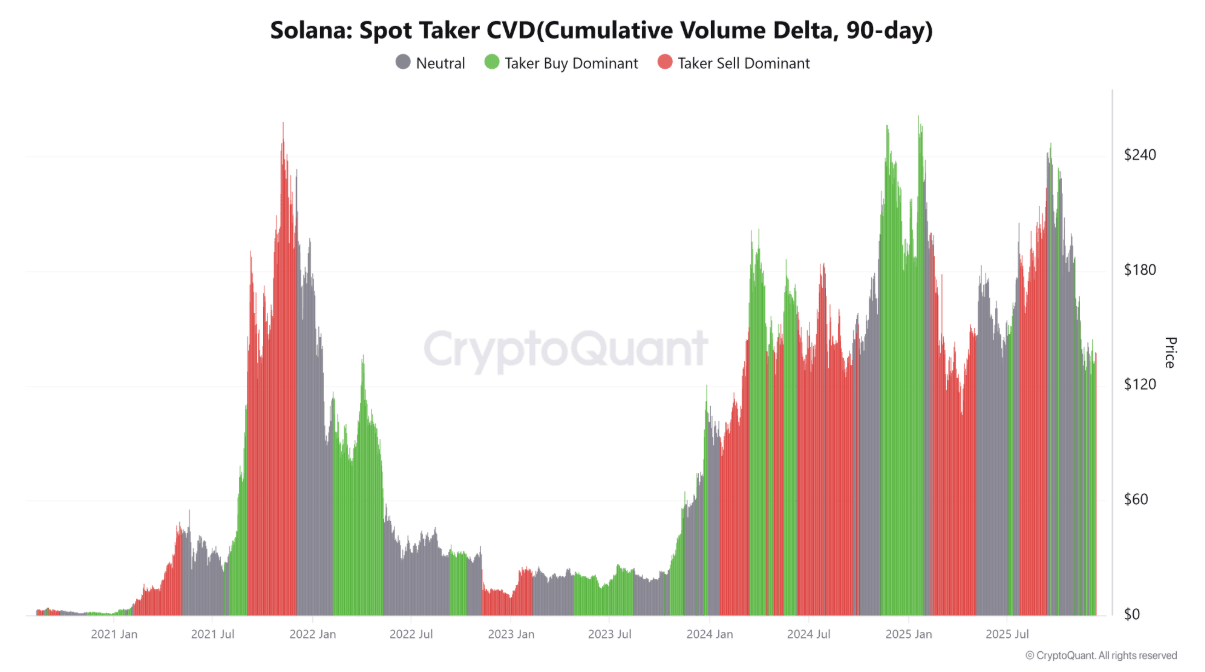 CVD chart of SOL | Source: CryptoQuant
Additionally, the Futures Average Order Size indicator from CryptoQuant — which tracks the average size of SOL futures trading orders — is recording an increase in smaller-sized orders. This indicates that retail investor participation is rising, a signal that often does not bode well for SOL's price action.
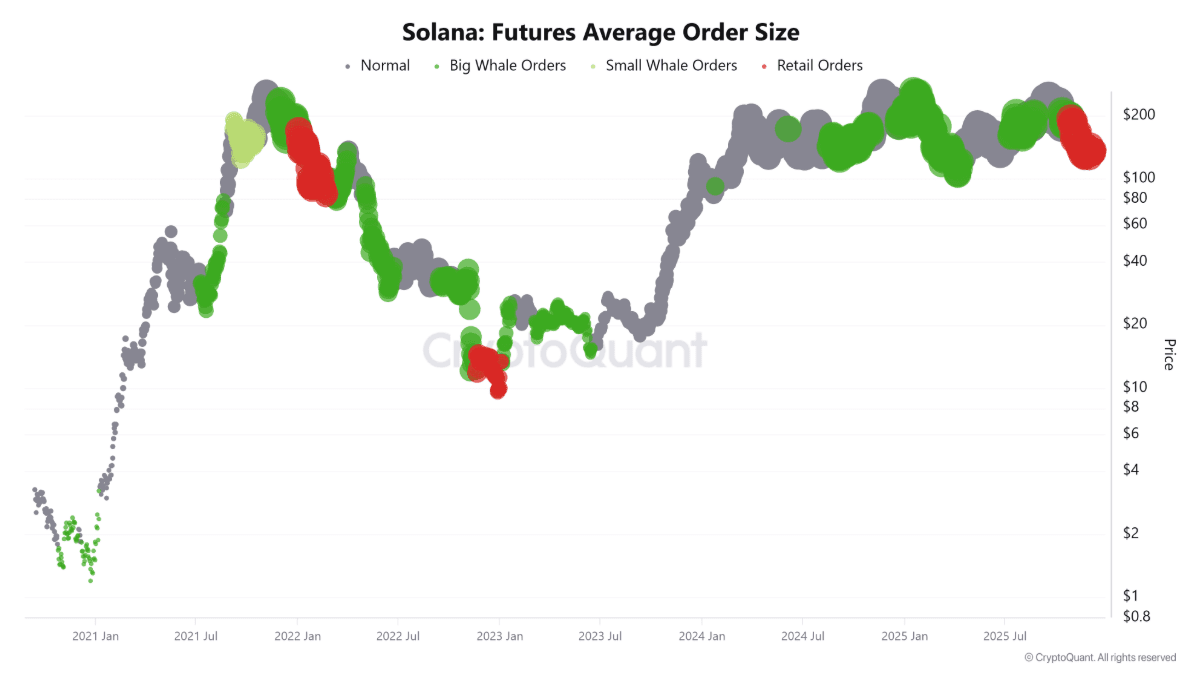 Average order size indicator chart of Solana Futures | Source: CryptoQuant
Solana price forecast: SOL rejected at a critical level
The price of Solana continues to face pressure as it was rejected at the upper trendline of the descending wedge pattern on Wednesday. By Thursday, SOL dropped 3.87% and traded around 130.99 USD.
If selling pressure persists, SOL could extend its correction towards the bottom of November 21 at 121.66 USD.
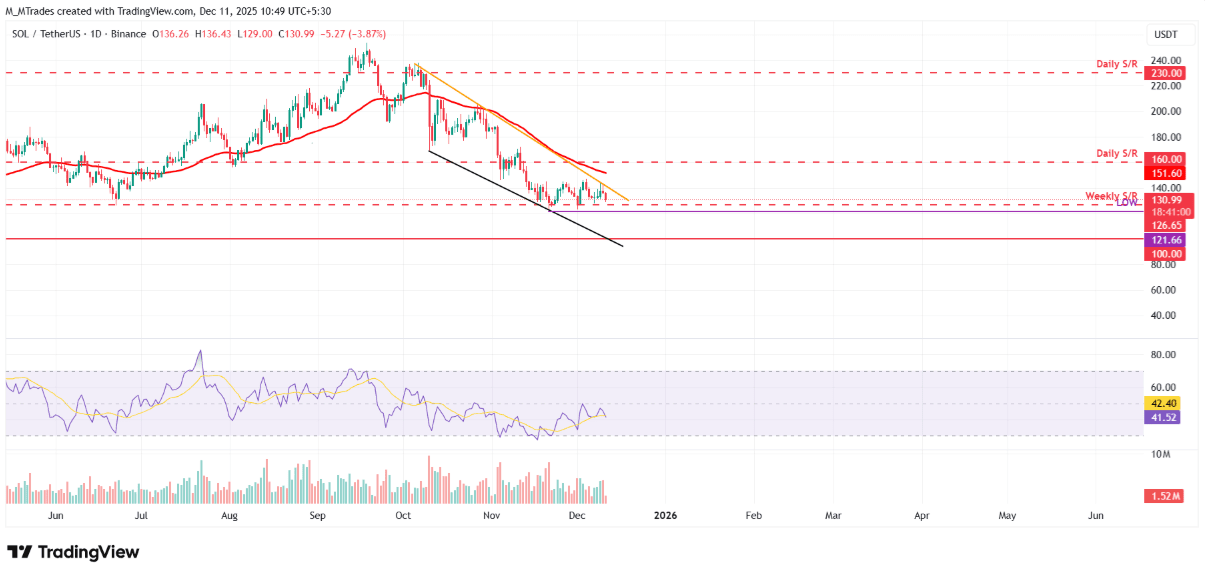 Daily SOL/USDT chart | Source: TradingView
On the daily frame, the RSI indicator is at 40 – below the neutral threshold of 50 and still trending down – indicating that bearish momentum remains dominant.
However, in a recovery scenario, SOL could regain upward momentum and test the 50-day EMA line at 151.60 USD.
https://coinphoton.com/solana-suy-yeu-giua-lan-song-quan-tam-gia-tang-tu-trader-nho-le.html


