

SOL/USD continues to trade inside a medium-term descending channel, with the price repeatedly failing to break above 125.00 (Murray [5/8]). The pair has now shifted into a sideways consolidation between 143.00 and 125.00 (23.6% Fibonacci), and today SOL is again testing the lower boundary of this range amid cautious Fed projections, which suggest policymakers may deliver only one rate adjustment next year.
Despite brief attempts at a rebound, the broader structure remains bearish. A confirmed breakdown below 125.00 would reactivate downside momentum toward 100.00 (Murray [4/8]) and 75.00 (Murray [3/8]).
For buyers, the key resistance lies at 150.00–143.00 (Murray [6/8], 23.6% Fib). A breakout above this area would signal an escape from the descending channel and open the way toward 183.80, 200.00, and 225.00.
Technical indicators remain mixed:
• Bollinger Bands are flat, showing the market is compressing.
• MACD stays in negative territory.
• Stochastic is attempting to turn lower.
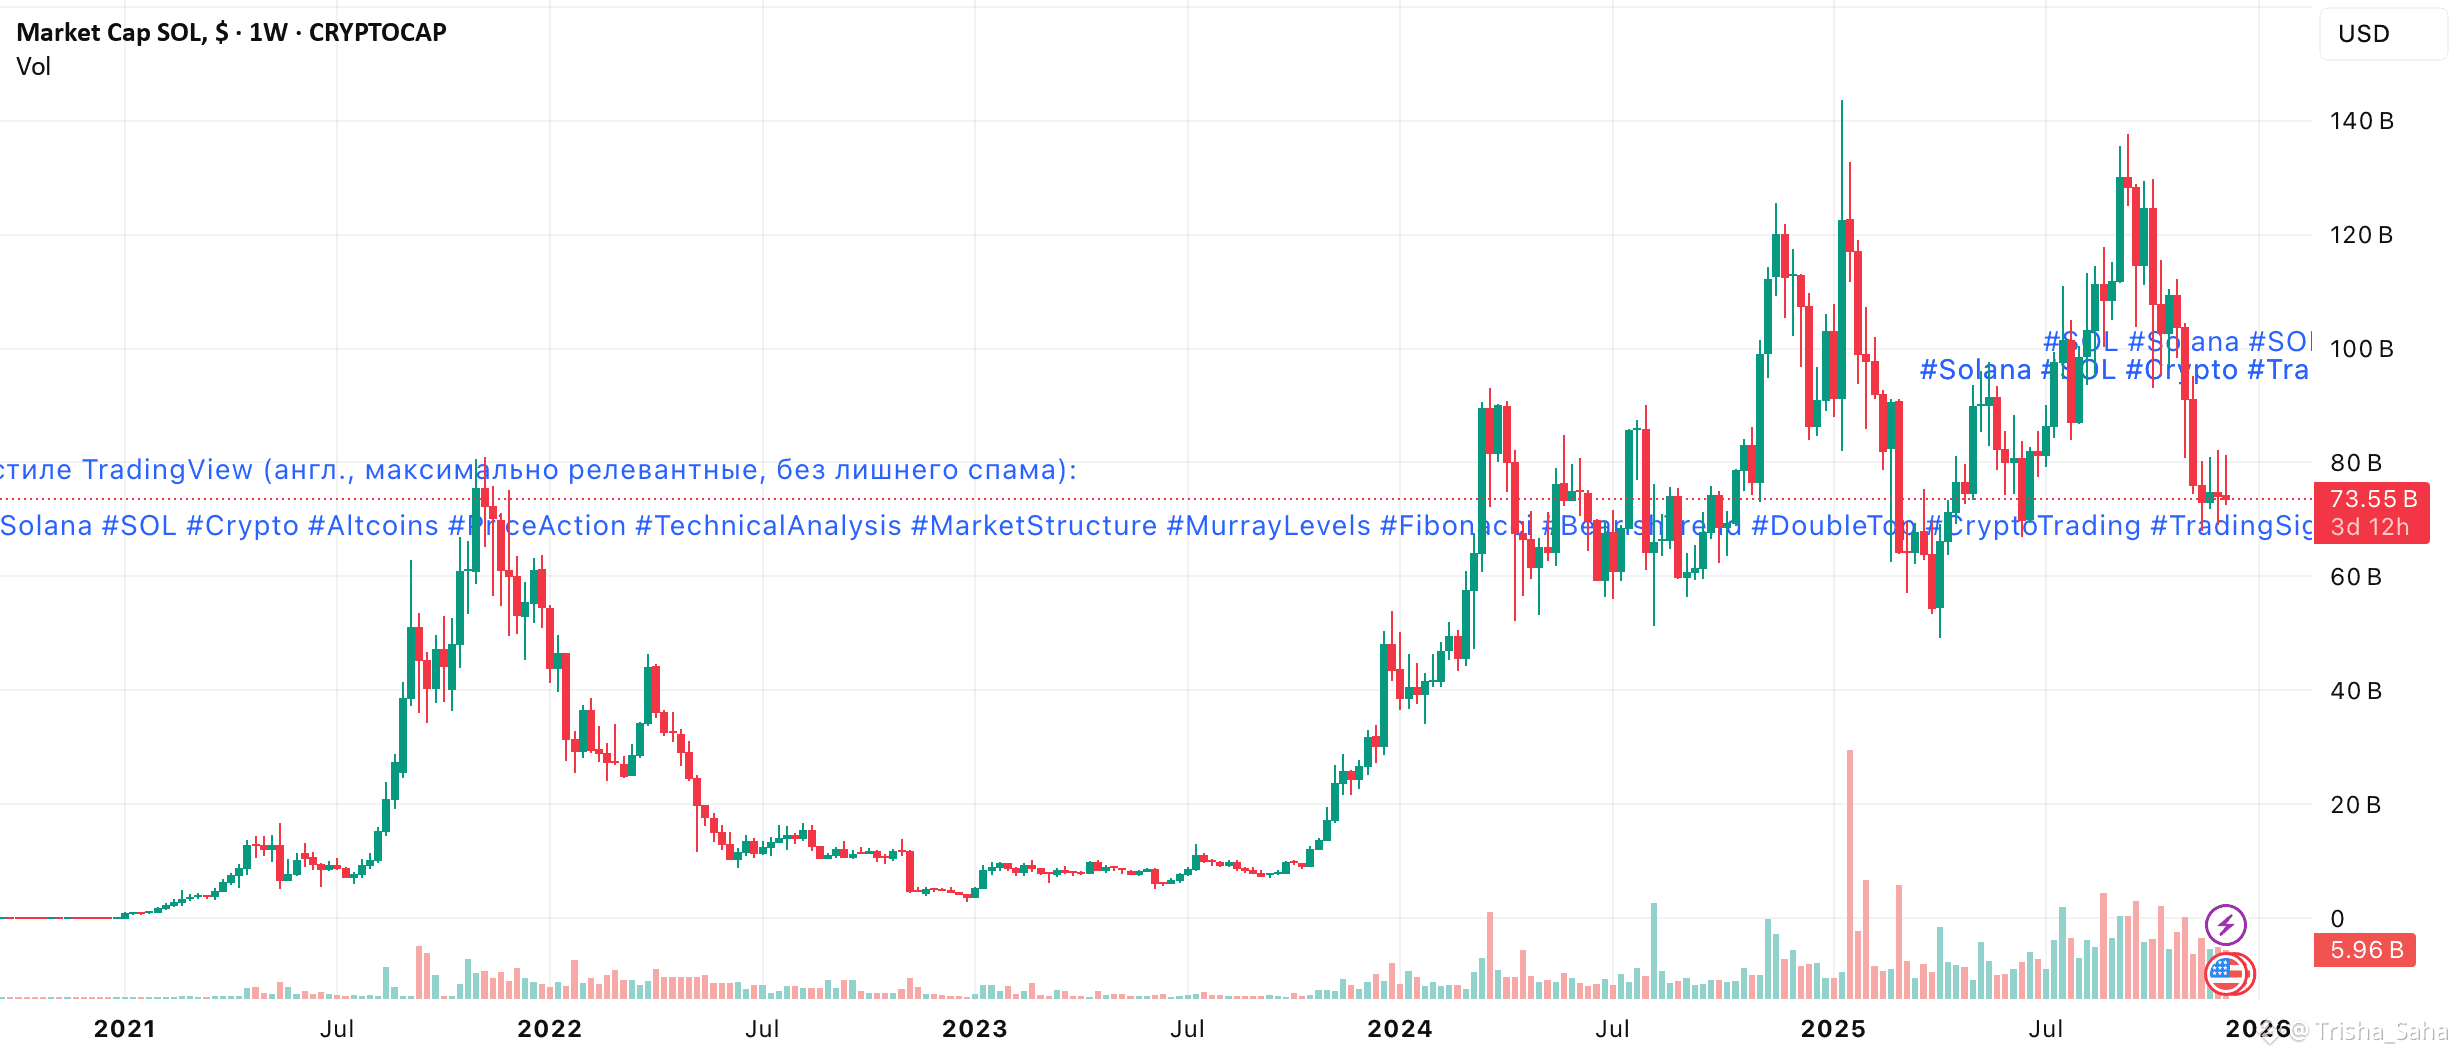
On the weekly timeframe, SOL/USD still shows signs of a forming double-top, reinforcing the bearish case toward 93.75 (Murray [3/8], W1).
⸻
Support and Resistance Levels
Resistance: 150.00 • 183.80 • 200.00 • 225.00
Support: 125.00 • 100.00 • 75.00
⸻
SOL/USD Trading Scenarios (Weekly)
Primary Scenario — SELL STOP
Entry: below 125.00
Take Profit: 100.00 • 75.00
Stop Loss: 142.90
Horizon: 5–7 days
⸻
Alternative Scenario — BUY STOP
Entry: above 150.00
Take Profit: 183.80 • 200.00 • 225.00
Stop Loss: 130.00
