Ethereum buyers are gradually regaining an advantage as the Net Taker Volume index on Binance shows clear signs of recovery.
This indicator reflects the difference between buying and selling pressure of ETH through market orders. After dropping to a low of nearly -500 million USD in October — a time marked by strong ETH selling pressure — the index has significantly improved to -138 million USD.
Although still in negative territory, the narrowing selling pressure indicates that the group of active buyers is returning, opening up the possibility of a new upward momentum forming. In a report on Thursday, expert Maartunn from CryptoQuant suggested that this is a positive sign for the market structure.
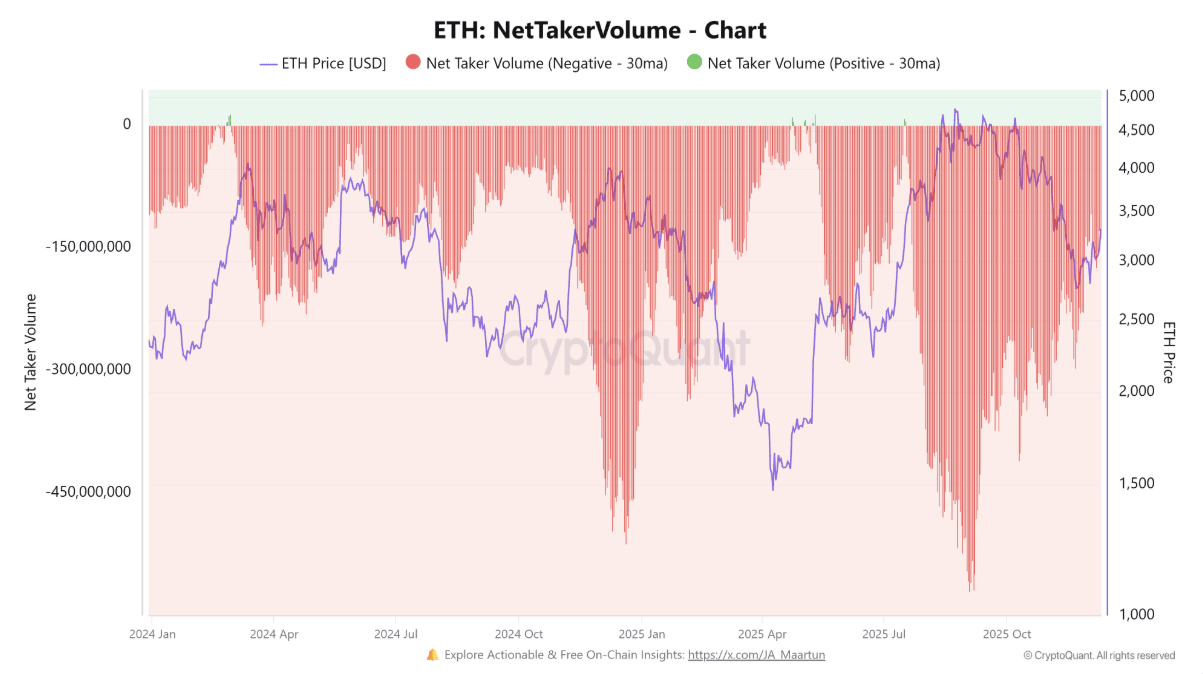 Net trading volume of ETH | Source: CryptoQuant
Additionally, the increase in Net Taker Volume when prices are in the low range often coincides with bottoming phases. This view is also supported by Tom Lee, President of the Ethereum treasury at BitMine.
BitMine accelerates ETH acquisition
In the Farokh Radio podcast, Lee revealed that 'BitMine believes Ethereum has bottomed out,' while affirming that the company is 'acting in accordance with what has been stated.'
He stated that the amount of ETH that BitMine has purchased has more than doubled in just two weeks. According to the smart money tracking platform EmberCN—citing data from Arkham—BitMine is said to have bought 33.504 ETH through FalconX on Wednesday, although the company has not yet provided official confirmation.
The latest update shows that BitMine has acquired 138,452 ETH in the past week, bringing the total ETH held to 3.86 million. The company currently has about 1 billion USD in cash, providing strong financial flexibility to continue pushing its accumulation strategy.
BitMine's long-term goal is to hold 5% of the total circulating supply of ETH.
Capital inflow into ETFs continues
According to data from Glassnode, the ETH spot ETFs have finally recorded 'the first signs of recovery' after several consecutive weeks of witnessing outflows. The total net assets (AUM) of this group of funds have increased by 28% since November 21, indicating that demand is gradually improving as we enter the end of the year.
However, this increase is still quite modest compared to the peak of 32 billion USD earlier in October, reflecting that institutional investor confidence has not yet fully recovered.
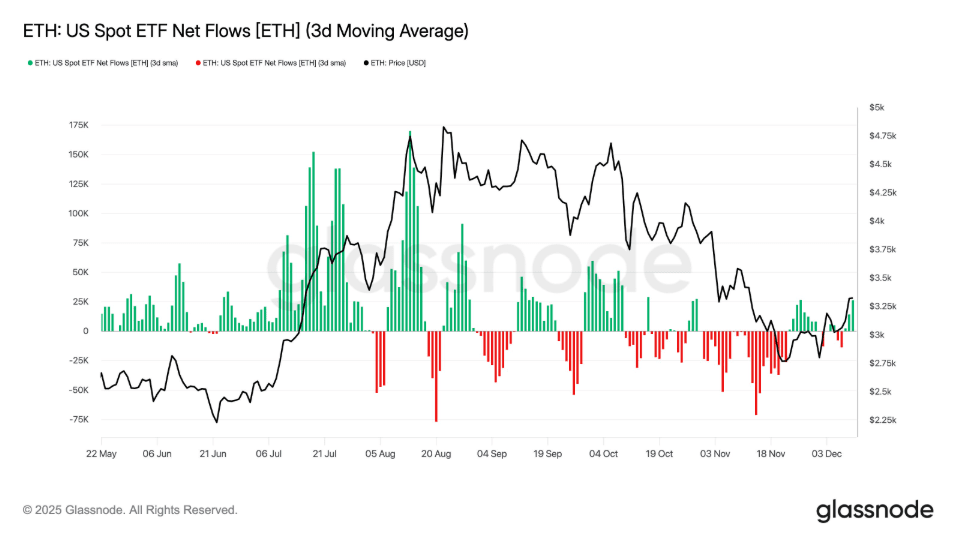 Net cash flow of ETH spot ETF | Source: Glassnode
Ethereum price forecast: ETH struggles below the resistance area of 3,470 USD and important EMA lines
Ethereum witnessed 134.8 million USD in positions liquidated in the past 24 hours, with long orders alone accounting for 105.4 million USD, according to data from Coinglass.
After a sharp drop, ETH rebounded from the support level of 3,100 USD, but the rapid recovery faced challenges at the 3,470 USD mark—where the 200-day EMA and 100-day EMA converge. Notably, the 50-day EMA continues to be a 'hard barrier,' as ETH has repeatedly failed to close above it in the last two sessions.
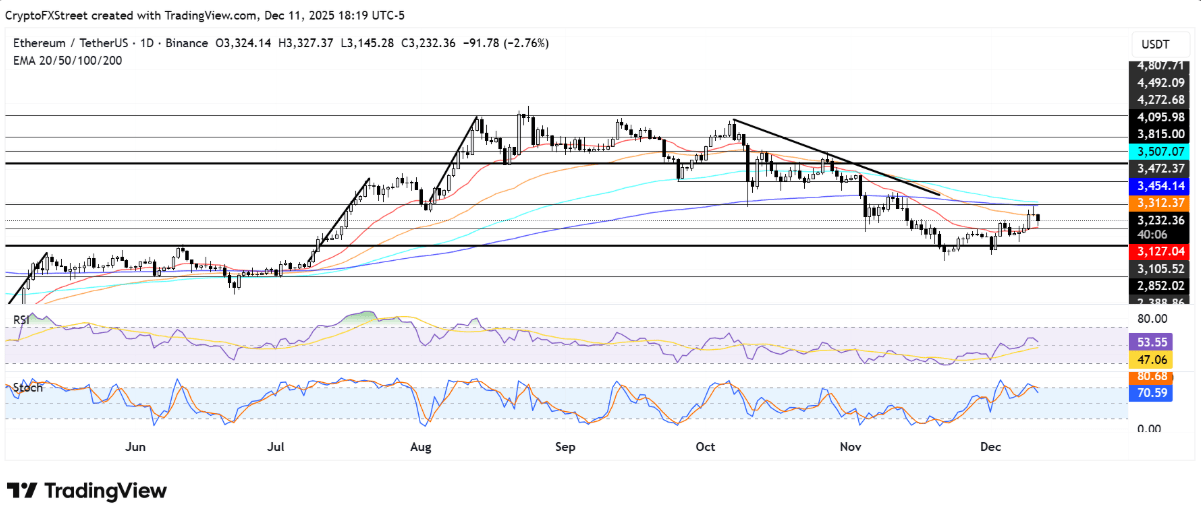 ETH/USDT daily chart | Source: TradingView
If the price can firmly close above the significant EMA cluster along with the 3,470 USD mark, ETH is likely to target the resistance area of 3,800 USD, before challenging the strategic level of 4,100 USD. Conversely, the bulls will need to defend nearby support at 3,100 USD and the 20-day EMA, with the area of 2,850 USD being a deeper defensive point if the 3,100 USD level is breached.
Currently, both RSI and Stochastic Oscillator are maintaining above neutral levels but have started to turn down, indicating that upward momentum is gradually weakening.
https://coinphoton.com/du-bao-day-ethereum-cua-tom-lee-trung-khop-voi-dong-thai-tich-luy-cua-nha-dau-tu.html
