Bitcoin is approaching the Christmas holiday of 2025 in a state that is both fragile and exciting. After weeks of pressure, Bitcoin prices are currently trading around $93,000. Four key charts reflect a market that is in the final stages of the correction process but still lacks clear momentum for a new bull cycle.
Data shows that three major forces are influencing the market. Recent buyers are suffering heavy losses, while new “whales” have begun to surrender. Macroeconomic factors still control price movements, although spot buying pressure is gradually returning quietly.
Short-term holders are under severe loss pressure
The first chart focuses on the actual profits and losses of the short-term holder group (Short-Term Holders – STH), meaning the Bitcoins bought in the last few months. Their 'actual price' is the average cost price of these coins.
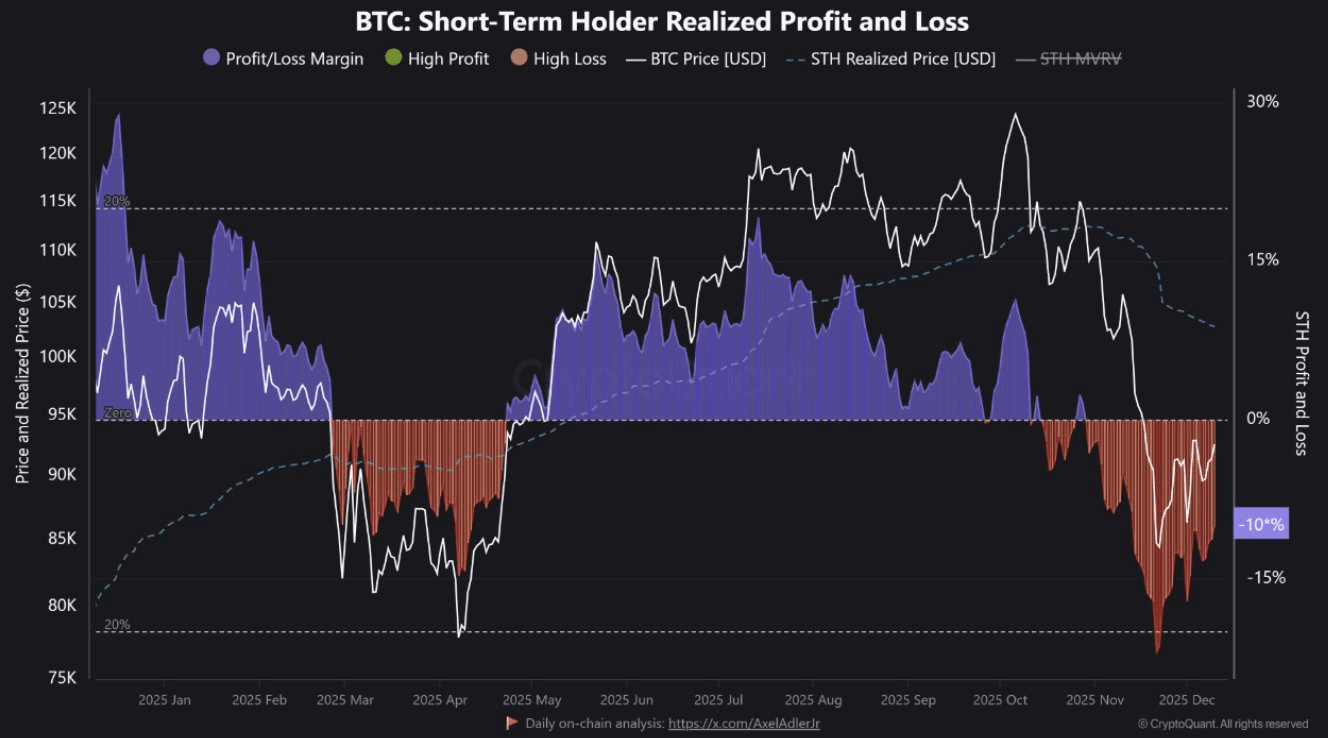 Profits and losses that short-term Bitcoin holders have received | Source: CryptoQuant
At the beginning of 2025, the STH group had impressive profits, with an average position profit of 15%–20% when Bitcoin was continuously rising. This drove profit-taking activity and created strong selling pressure near peak areas.
However, the current situation has reversed. Bitcoin is now trading below the actual price of STH, causing this group to incur losses of about -10%. The chart has turned red, marking one of the deepest loss periods of the year.
This leads to two consequences:
In the short term, investors who are 'stuck' tend to sell whenever prices recover, primarily to exit their positions at breakeven, thereby limiting price increases.
However, deep and prolonged loss zones often appear in the final stages of the correction process, signaling that weak-handed investors have suffered significant losses.
At a certain point, selling pressure from this group will decline.
Historically, important reversal signals appear when prices rise above the actual price of STH from below. This indicates that forced selling has been absorbed and new demand is dominating the market.
Until this signal appears, the market still needs to be cautious and prioritize trading within the current range.
New whales surrendering: A positive sign for recovery
The second chart tracks the actual profits and losses of whale groups, divided between “new whales” and “old whales.” New whales are large investors who have recently accumulated Bitcoin.
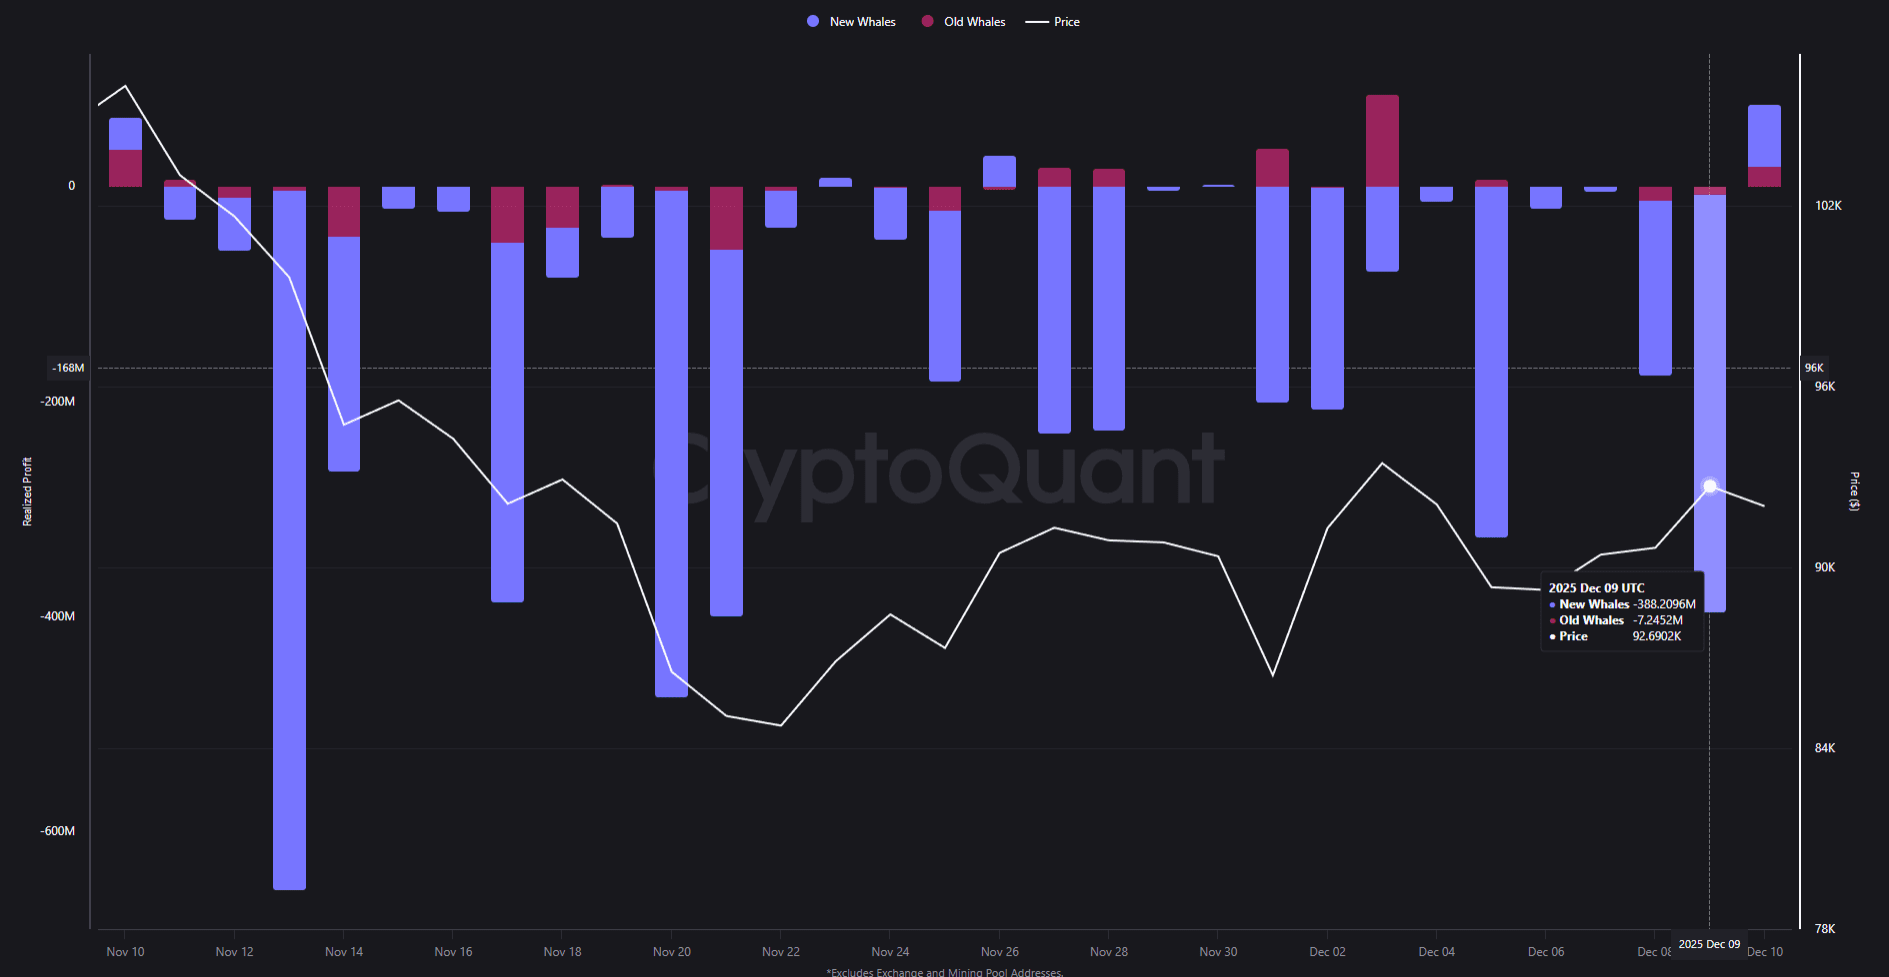 The actual profit that Bitcoin “whales” have made since November 2025 | Source: CryptoQuant
Just yesterday, new whales recorded losses of up to $386 million. The chart shows a large negative column, along with many other negative columns concentrated around recent lows.
In contrast, old whales have smaller, more balanced profits and losses, and do not withdraw strongly like the new group.
This is a pattern often seen in the final stages of the correction process. New whales often buy in late, may use leverage, or get caught up in leading stories. When prices move against them, they are the first to surrender.
This surrender brings structural benefits to the market: Bitcoin is shifting from weak large investors to stronger or smaller investors, helping to reduce future selling pressure from this group.
In the short term, these sell-offs could still pull prices lower. However, in the medium term, it helps improve the quality of the Bitcoin holding group, making the market more sustainable as panicking large investors withdraw.
Real interest rates remain the leading factor driving the trend
The third chart compares Bitcoin price movements with the two-year real interest rate in the U.S. (which has reversed). Real interest rates reflect the interest rate after inflation, and in 2025, this index is nearly moving in sync with Bitcoin.
When real interest rates decrease, the reversal line on the chart rises and Bitcoin also increases, thanks to improved liquidity. Lower real interest rates make risk assets more attractive compared to safe bonds.
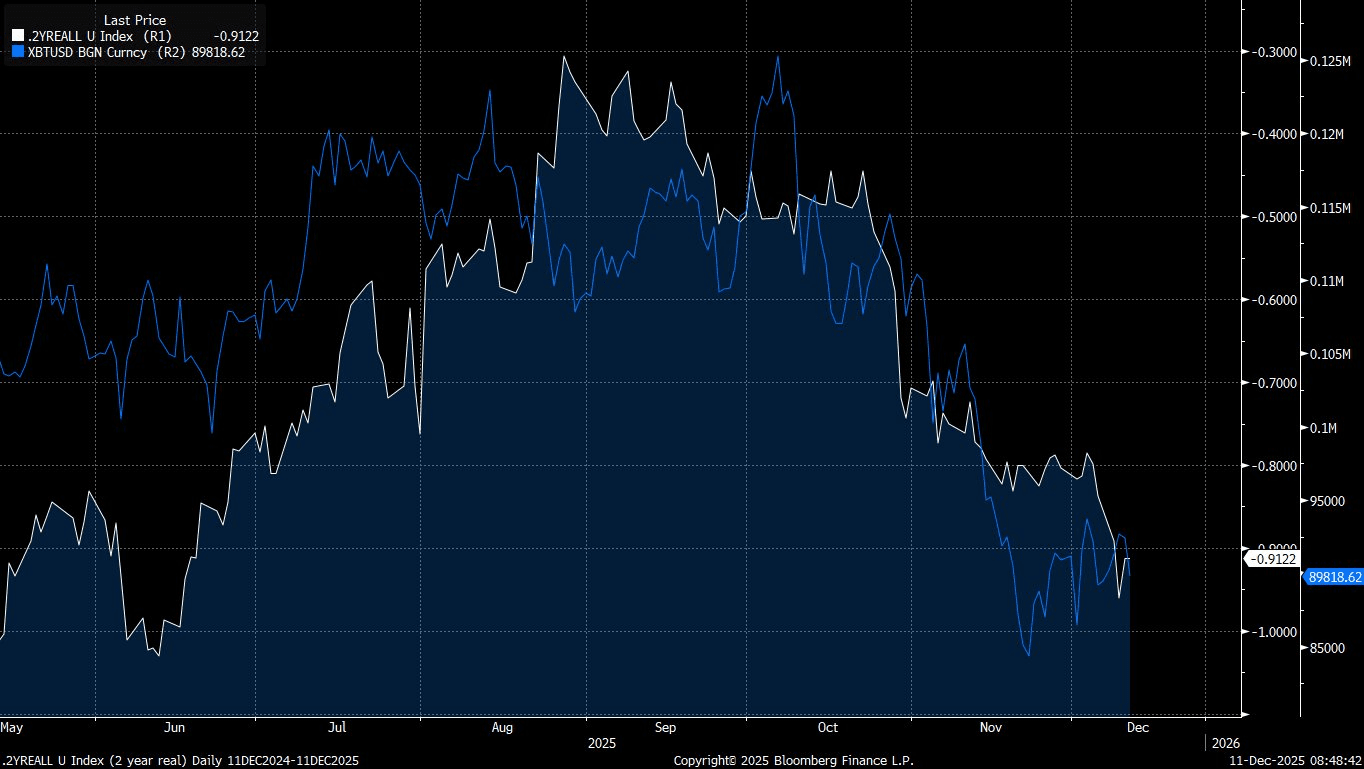 The two-year real interest rate reverses with the overlapping BTC chart
Since the end of summer, real interest rates have risen again, pulling the reversal line up and Bitcoin prices down. This indicates that macroeconomic factors are still influencing the larger market trend.
The Federal Reserve's interest rate cuts may not fully resolve the issue. What matters is the market's expectations about the actual borrowing costs in the future. If inflation expectations decrease faster than nominal interest rates, real interest rates may still rise.
For Bitcoin to initiate a sustainable new bull cycle, real financial conditions need to be loosened further. Until the bond market reflects this change, BTC's recoveries will continue to face macroeconomic resistance.
Spot buying pressure returns: Early reversal signal
The fourth chart tracks the 90-day CVD Taker Spot index on major exchanges, measuring the net volume of market orders exceeding the price spread. This index shows whether buyers or sellers are actively dominating.
During the recent price decline, the market was primarily in a Taker Sell Dominant state, with red columns covering the chart as sellers continuously pushed prices down. This aligns with the prolonged downward price trend.
However, the signal has begun to reverse. The index just shifted to Taker Buy Dominant with green columns appearing again, indicating that active buyers are surpassing sellers on spot exchanges.
This is an early but very important change, as trend reversals often start from such micro changes: first, buying pressure appears, then prices stabilize, and finally, new large capital enters.
One day of data is not enough to confirm a trend, but if the green state is maintained, it will be evidence that actual demand has returned and the spot market is absorbing supply from the STH group and surrendering whales.
Bitcoin price prospects before Christmas 2025
Combining the four charts above, the Bitcoin market is currently in the final stages of the correction process, not the beginning of a new bull cycle.
Short-term holders and new whales are still facing heavy losses and continue to sell as prices rise. Macroeconomic real interest rates are still limiting investors' risk appetite.
However, some positive factors have emerged: the surrender of new whales helps clean the holder group, and spot buying pressure is returning, contributing to a slowdown in the price decline.
As we approach Christmas 2025, Bitcoin is likely to fluctuate within a narrow range with a downward trend, around $90,000. Significant drops to the $80,000 range may still occur if real interest rates continue to remain high.
A clear bullish reversal may require three consensus signals:
Prices must rise and hold above the actual price of the short-term holding group.
The two-year real interest rate needs to decrease, easing financial conditions.
The Taker Buy Dominant state must be maintained, confirming strong spot demand.
Until these consensus signals appear, the market will continue to experience strong volatility under the influence of macroeconomic data and selling pressure from 'stuck' investors. For long-term investors, this is a suitable period to plan rather than make risky investment decisions.
https://coinphoton.com/4-bieu-do-giai-thich-tinh-hinh-gia-bitcoin-truoc-them-giang-sinh-nam-2025.html
