1️⃣ General Context (Macro Price Context)
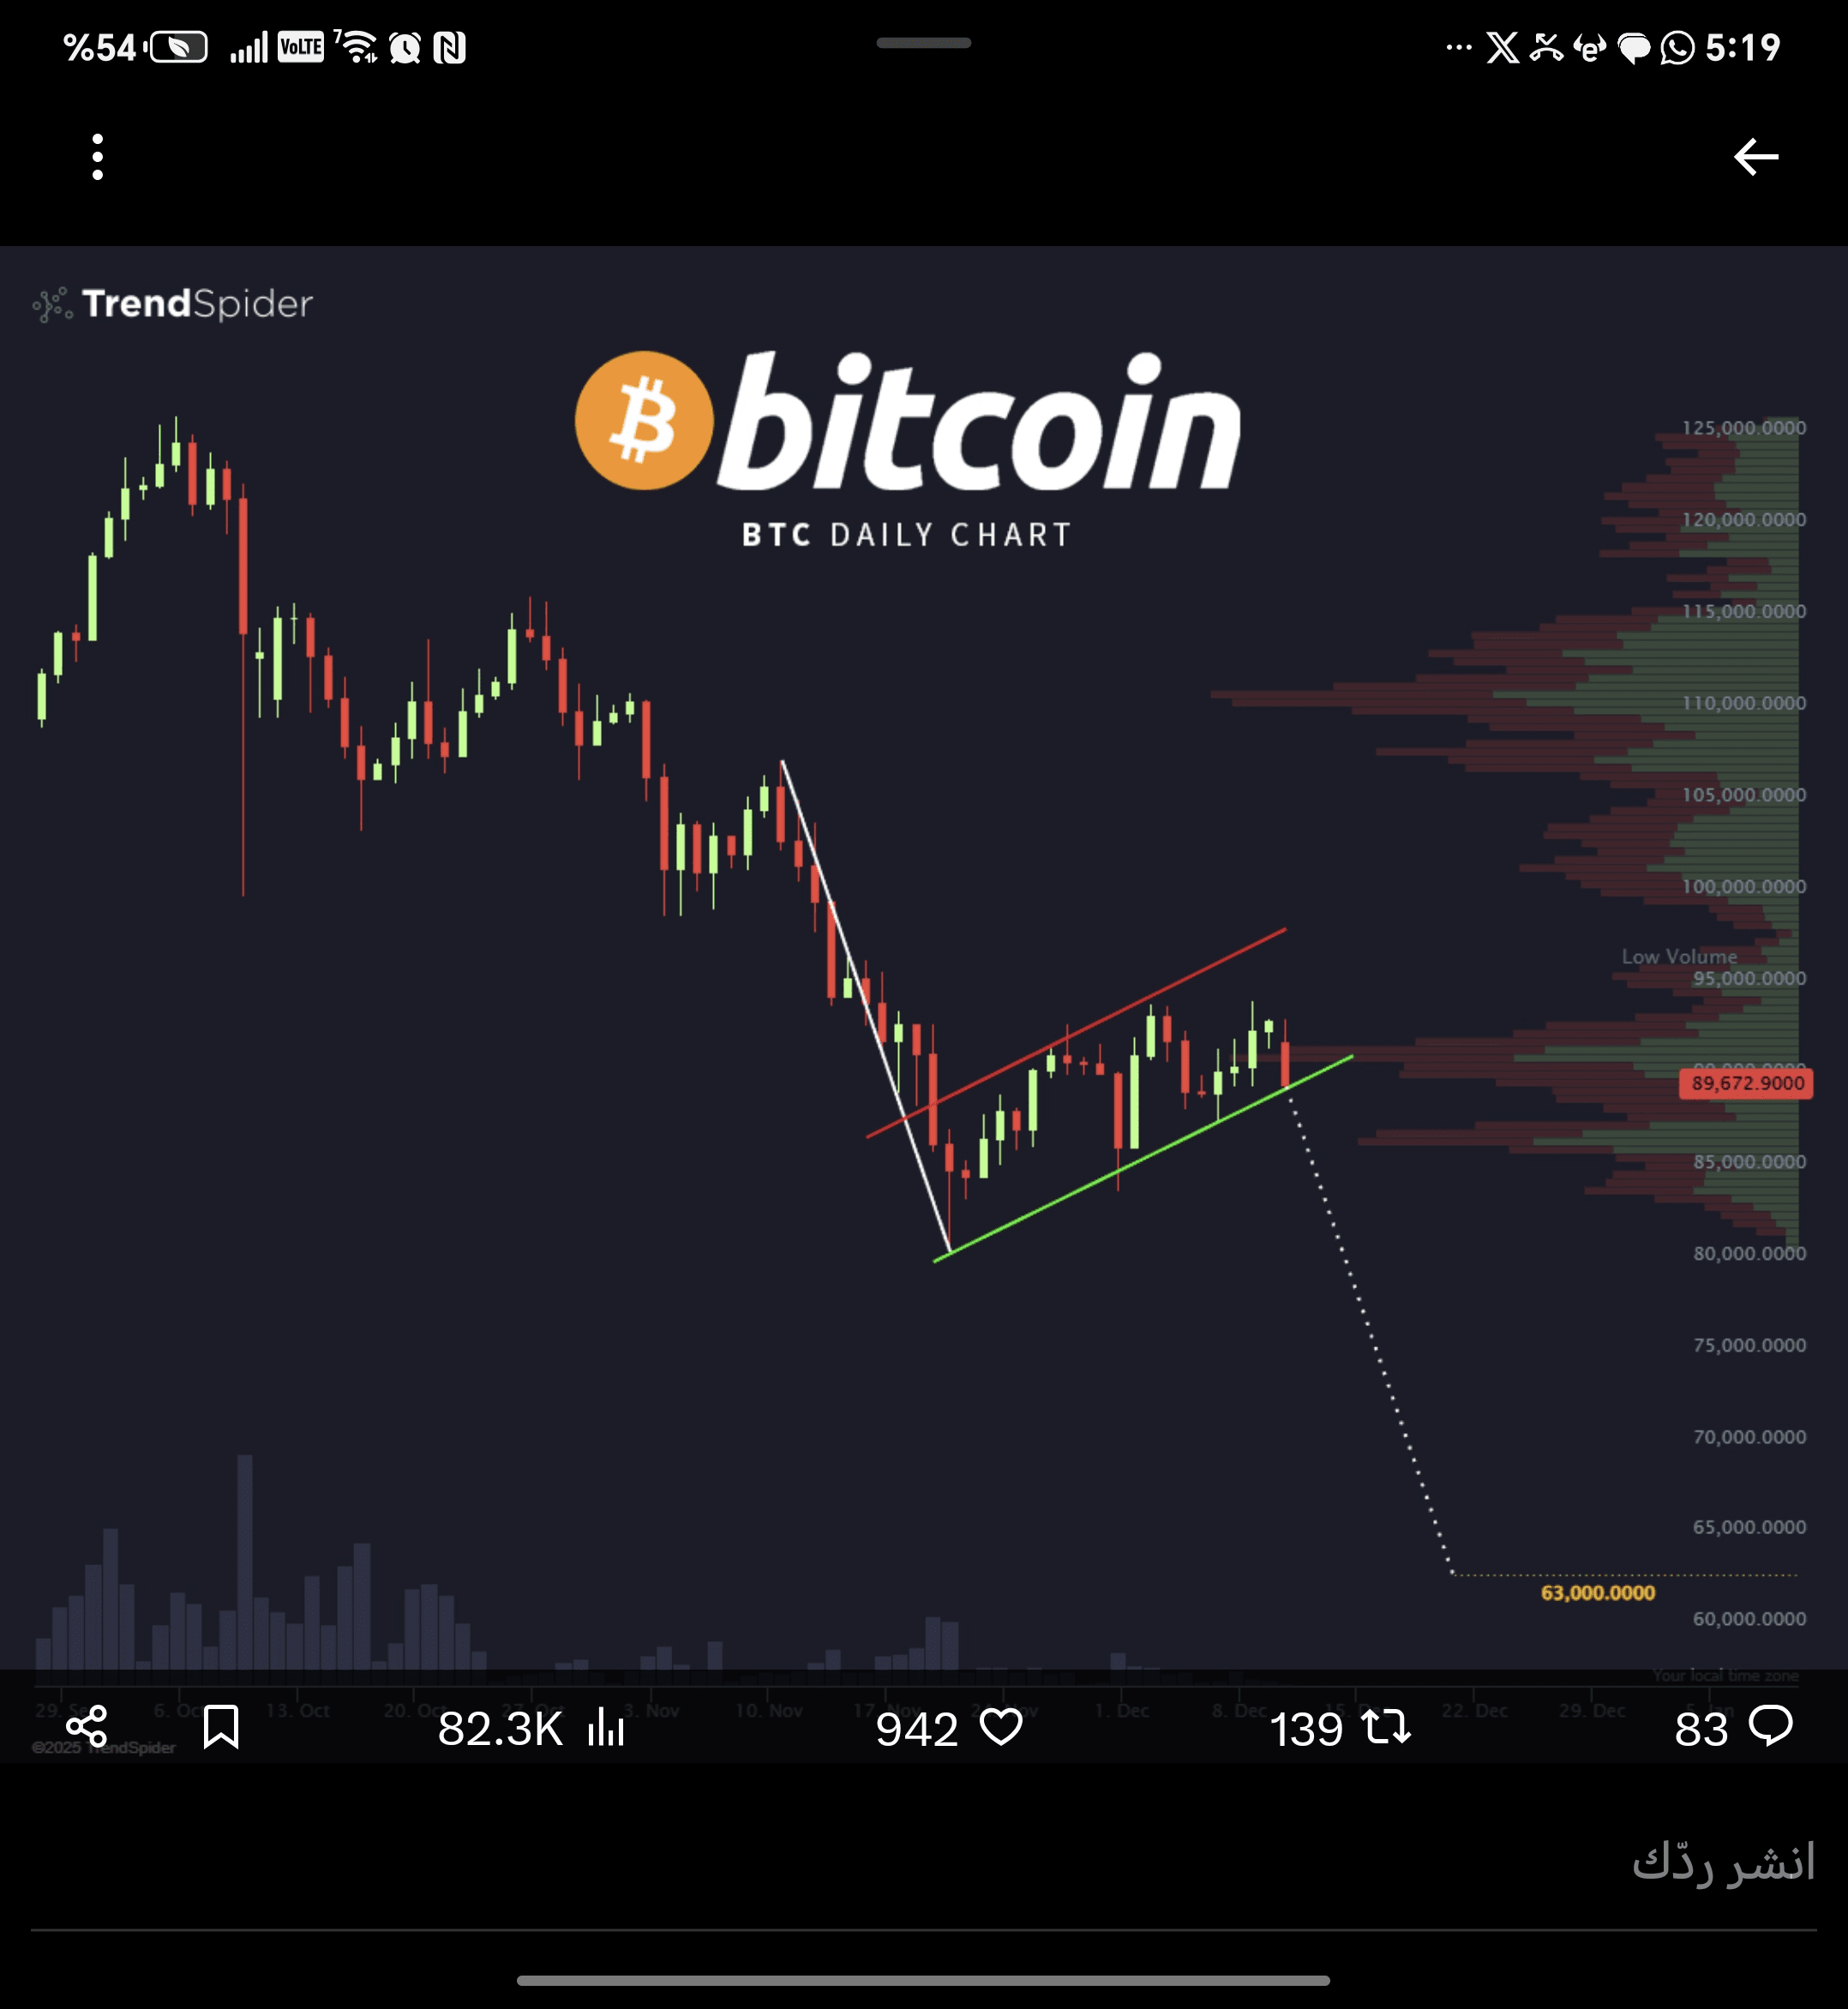
Bitcoin experienced a strong and sharp drop from high peaks (around $120,000) down to areas close to $80,000.
This drop formed a clear downward impulse move with high momentum.
After this drop, there was no structural upward reversal, but the price entered a weak and organized retracement.
📌 Contextual Summary
The previous trend was strongly bearish, and this is a prerequisite to consider any subsequent retracement as corrective rather than a reversal.
2️⃣ Current Technical Pattern (Technical Pattern Identification)
🔻 Main Pattern:
Bear Flag / Rising Channel after a Sharp Drop
Flagpole:
The sharp previous drop (shown by the descending white/red line).
Flag:
Narrow ascending price channel between:
Ascending support (green line)
Slower ascending resistance (red line)
📌 This formation:
Exhibits Bear Flag characteristics
Partially overlaps with Rising Wedge
Both patterns are negative in this price context
3️⃣ Professional Technical Interpretation
Retracement within the channel:
Weak
With low momentum
Without a structural upward break
This behavior matches:
Continuation Pattern in classical analysis
Corrective Wave in Elliott framework
Weak Demand Rally in Wyckoff
📌 Conclusion
The current rise is purely corrective and acts as an exhaustion phase before resuming the bearish trend.
4️⃣ Volume and Liquidity Analysis
During the formation of the flag:
Volume is low → confirms the corrective nature
On the right side of the chart (Volume Profile):
The price is moving within a Low Volume Node
The area between ~88,000 – 95,000 lacks real support
📌 Result:
If support is broken, the drop will be swift until reaching a high liquidity area (HVN).
5️⃣ Critical levels and scenarios
🔴 The primary scenario (most likely technically)
Clear break of the green support (the flag):
Target 1: 80,000 – 78,000
Target 2: 72,000 – 70,000
Classic final target: 63,000
🎯 Reason 63,000:
Drop of the pole length
Historical demand zone
High liquidity level + psychological support
🟢 Cancellation Scenario (Bullish Invalidation)
This scenario is conditional and currently difficult:
Requires:
Clear breakout of the upper red line
Daily close above 95,000
With a strong increase in volume
📌 Without these conditions:
Any rise is considered only a temporary retracement.
6️⃣ Time Factor
Continuation of oscillation within the flag for a long time:
Weakens the pattern
But it does not negate its negativity except by upward breakout
Time is currently working against the bullish scenario
7️⃣ Practical Plan
❌ What is not recommended:
Buying within the ascending channel
Chasing green candles
Relying on news or emotion
✅ What is recommended:
Waiting:
Break of support → dealing with the bearish scenario
Or breakout 95k with volume → reevaluate the trend
Focus on real liquidity areas, not empty areas
🏁 Unified Final Verdict
> Bitcoin is currently moving within a Bear Flag continuation pattern after a strong impulsive drop.
The current retracement is weak, volume is low, and liquidity below the price is greater than above.
As long as the price remains within the channel and does not break 95,000$, the bearish scenario towards 80k then 63k remains the technically likely scenario.
Any talk of an upward reversal before the cancellation conditions are met is premature.