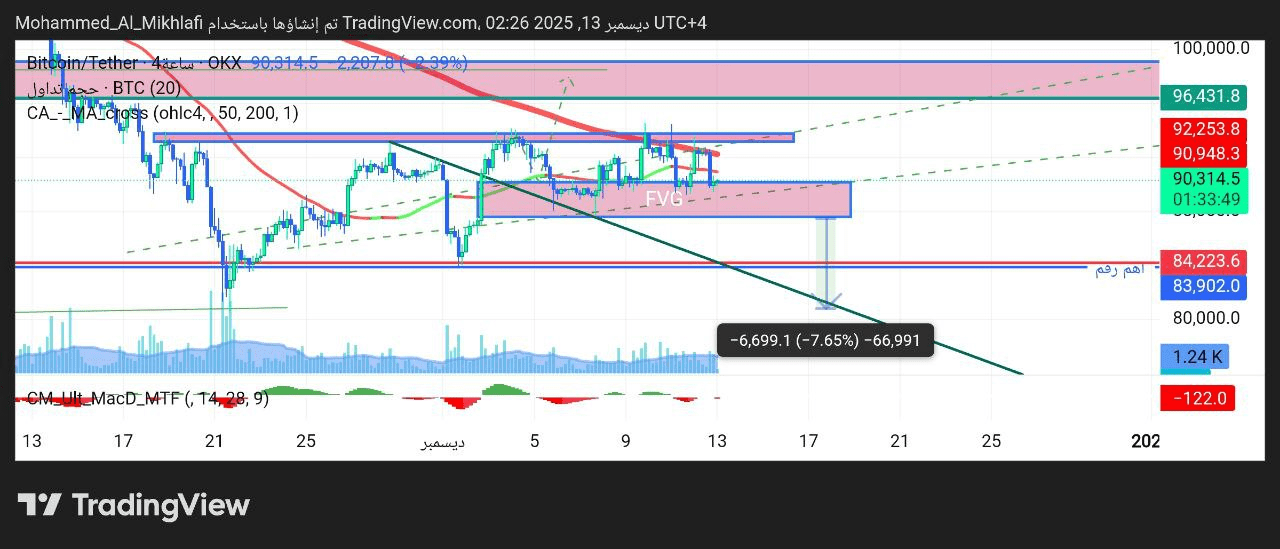
4-Hour Frame Analysis (4H)
In previous analyses, I mentioned that there was a bearish divergence, and although Bitcoin rose and tested the area of 93175–93808 and did not close above it, this clearly indicated a negative outlook for the price. It actually achieved the first target of 94K after touching the buying areas of 90–87.
But as soon as the four-hour candle closed below the level of 93808 by just a few dollars, Bitcoin dropped immediately.
Now on the four-hour timeframe:
If the pressure continues and the level of 87700 is broken → the target is directly 80800 without complication.
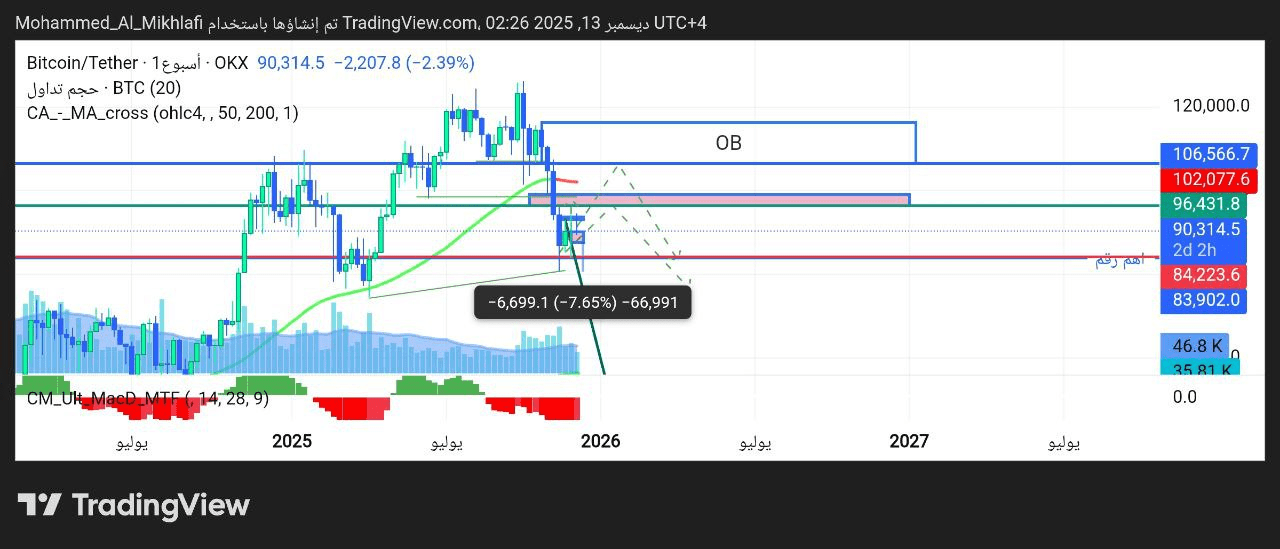
Daily timeframe analysis (1D)
On the daily, there is a descending wedge with a primary target at 84K.
The longer the price moves within the same area (like what's happening now, staying above 4 candles in the same place), the more the target price decreases, and it may reach the target of 82K and so on.
The negativity remains as long as Bitcoin is below 93175–93808.
This negativity will not be canceled unless there is a break and a daily close above 93175–93808.
Below it, the situation remains negative.
The expected buying areas on the daily are 84–80K.
---
Weekly timeframe analysis (1W)
On the weekly timeframe, Bitcoin is still positive, and it is now in the process of forming the weekly bottom, with a clear positive divergence on the weekly.
Even if Bitcoin drops to very low levels, as long as it does not close weekly below 83902 → the weekly trend remains positive and a return towards 96–102K is expected.
But if it closes weekly below 83902:
I will publish a complete new analysis for the next Bitcoin cycle because it means a major directional change.